
Intel (INTC): Finding Foundry
Price target
$175
Access
Free note
We expect a significant beat; customer-funded capacity is the re-rating catalyst | PT $175
INH Capital | Equity Research | Q3 FY26 Earnings Preview | Published Oct 27, 2026; updated Oct 28, 2026
Superseded. This preview (v1.1) is superseded by our Oct 30, 2026 note, Intel (INTC): Downgrade to Hold, PT $80 (v2.0). The content below is unchanged from Oct 28, 2026 and is kept for the record.
| Summary | |
|---|---|
| Price target | $175 |
| Price (Oct 27 close) | $93.74 |
| Implied upside | +86.7% |
| Market cap | $495.4B (5,285.07M shares) |
| Q3 non-GAAP EPS: INH / consensus / Street high / guide | $0.55 / $0.40 / $0.49 / $0.38 |
| Q3 revenue: INH / consensus / guide | $17.6B / $16.49B / $15.8-16.8B |
| Q3 non-GAAP gross margin: INH / guide | 44.9% / 42.0% |
| Q4 non-GAAP EPS: INH / consensus | $0.59 / $0.44 |
| FY26E / FY27E EPS: INH vs consensus | $1.85 vs $1.54 / $2.70 vs $2.18 |
| Report date | Thu Oct 29, after the close (confirmed, Intel IR calendar); 2 sessions away |
Source: Intel filings and IR calendar (accessed Oct 27, 2026); Yahoo Finance consensus (accessed Oct 27, 2026, 5:50 PM ET); Nasdaq daily prices (Oct 27 close); INH Capital estimates.
Key takeaways
- The narrative is the catalyst: customers are starting to fund the foundry. The stock re-rates when investors see that Intel's capacity build is being paid for, in part, by the customers who will use it. The CFO said on the Q2 call that Intel has "had prepays from customers" that unlocked capacity, and that Intel would not place 2027 tool orders without "pretty significant confidence in our customers." We believe those commitments are larger and broader than the market prices, and we expect the call to start putting numbers on them.
- We expect a significant beat. We model Q3 non-GAAP EPS of $0.55, 38% above consensus of $0.40, 45% above the $0.38 guide and above the $0.49 Street high. Revenue of $17.6B is 6.7% above consensus and above the $16.8B top of the guide. Our +$0.17 beat vs guide is in line with Intel's record: the last four quarters beat the EPS guide by an average of $0.20, and the median beat over eight quarters, excluding impairment charges, was $0.165.
- CPU pricing and demand. Intel confirmed price increases on select Xeon and Core parts in July, and it is still short of supply. The CEO said on the Q2 call that "strong demand for our products continue to outpace our growing supply," and the CFO said "server CPU demand continues to far outpace available supply" and that Intel "will be behind in the fourth quarter." The CFO raised the server outlook "again" and forecasts "strong double-digit unit growth for the industry this year and next, with momentum extending into 2028," with agentic AI lifting CPU density. Pricing into a supply-constrained market is the core of our margin call.
- The beat is pricing and gross margin. We raise Q3 non-GAAP gross margin to 44.9% (from 43.0%), 290bp above the 42.0% guide, on CPU price increases that Intel has confirmed, a richer data center mix and 18A yields that Intel says are running ahead of target. Q2 beat its margin guide by 280bp on "mix and pricing actions." We hold opex and below-the-line items at guide-consistent levels, so gross margin carries $0.088 of our $0.168 beat vs guide. It is our most aggressive call: 44.9% implies about 62% incremental gross margin vs Q3 2025, above the 40% to 60% range the CFO cited.
- DCAI growth raised. We now model DCAI revenue of $7.6B in Q3 (from $7.1B; +85% YoY) and $8.0B in Q4, for FY26 DCAI growth of 59% and 29% in FY27. Q4 EPS goes to $0.59 (from $0.57), FY26 to $1.85 (from $1.77) and FY27 to $2.70 (from $2.50).
- Three signals since our Oct 12 note. (1) CPU price increases are confirmed by Intel on select Xeon and Core parts, with the flagship Xeon 6980P list price up 12%. (2) Intel agreed on Oct 26 to acquire quantum software company Classiq; press reports put the price at about $2.3B in cash and stock. We read a discretionary deal three days before the print as confidence in the balance sheet. (3) We believe Apple has committed to Intel Foundry; neither company has confirmed it, and confirmation on the call would be the clearest evidence of customer-funded capacity.
- 14A PDK 0.9 is the next proof point. Intel guided the 14A PDK 0.9 to external customers in October, reaffirmed on the Q2 call and by the CFO on Aug 26, with PDK 1.0 for volume production in early 2027. On Oct 24 the CEO said "stay tuned" on 0.9, so we do not count it as delivered. In our view, 0.9 is the release that turns 14A engagements into capacity requests, and capacity requests are what precede prepayments. Confirmation on the call that 0.9 is in customers' hands, or a firm date before year end, would support the customer-funded capacity thesis.
- PT $175. 65x our FY27E EPS of $2.70. At $93.74 the stock trades at 43x consensus FY27 EPS and 35x ours. The S&P Global Street mean PT is $117.71 (47 analysts).
- Risk. The stock fell 10.5% from the Oct 9 close used in our last note, including an 8.0% drop on Oct 22 in a sector selloff, and closed below our $95 warning level from Oct 16 to Oct 27. It has fallen after 8 of the last 12 reports, with an average next-day move of 10.9%. Options price about 8% to 9% for the print (INH calc). A close below $81.88 invalidates the thesis; the stock is 14.5% above it.
1. What changed since our Oct 12 note
| Item | Oct 12 note | Oct 27 note | Why |
|---|---|---|---|
| Q3 revenue | $17.2B | $17.6B | Beat history; server supply landing late in Q3 |
| Q3 non-GAAP gross margin | 43.0% | 44.9% | Confirmed CPU price increases; DCAI mix; 18A yields |
| Q3 DCAI revenue | $7.1B | $7.6B | Server supply skewed to late Q3; wafers pivot from client to server |
| Q3 CCPG revenue | $9.1B | $9.05B | Client "flattish" per CFO; PC consumption sub-seasonal |
| Q3 non-GAAP EPS | $0.49 | $0.55 | Revenue and gross margin; opex and other at guide-consistent levels |
| Q4 gross margin / EPS | 43.5% / $0.57 | 44.9% / $0.59 | Q3 margin held flat; no credit for interest on the raise |
| FY26 EPS / GM | $1.77 / 42.4% | $1.85 / 43.3% | Sum of quarters; FY26 opex $16.5B |
| FY27 revenue / EPS | $76B / $2.50 | $77B / $2.70 | DCAI $34.6B (+29%); GM 45.5% |
| Non-controlling interest, Q3 | $0.28B | $0.25B | Corrected to the Q2 call guide (~$250M in each of Q3 and Q4) |
| Price | $104.70 (Oct 9) | $93.74 (Oct 27) | Sector selloff Oct 16 to Oct 22 |
Source: Intel Q2 2026 earnings release and call (Jul 23, 2026); Nasdaq daily prices; INH Capital estimates.
2. Our estimates vs consensus
| Metric | Intel guide | Consensus low | Consensus mean | Consensus high | INH Oct 12 | INH Oct 27 | INH vs mean |
|---|---|---|---|---|---|---|---|
| Q3 FY26 | |||||||
| Revenue | $15.8-16.8B | $16.28B | $16.49B (36) | $17.03B | $17.2B | $17.6B | +6.7% |
| Non-GAAP gross margin | 42.0% | n/a | n/a | n/a | 43.0% | 44.9% | +290bp vs guide |
| Non-GAAP EPS | $0.38 | $0.37 | $0.40 (36) | $0.49 | $0.49 | $0.55 | +38% |
| DCAI revenue | Not guided | n/a | n/a | n/a | $7.1B | $7.6B | Q2: $6.26B |
| CCPG revenue | "Up a bit" | n/a | n/a | n/a | $9.1B | $9.05B | Q2: $8.88B |
| Q4 FY26 | |||||||
| Revenue | Not yet guided | $15.61B | $17.06B (36) | $18.10B | $18.5B | $18.5B | +8.4% |
| Non-GAAP gross margin | Not yet guided | n/a | n/a | n/a | 43.5% | 44.9% | n/a |
| Non-GAAP EPS | Not yet guided | $0.32 | $0.44 (36) | $0.55 | $0.57 | $0.59 | +34% |
| DCAI revenue | Not guided | n/a | n/a | n/a | n/a | $8.0B | n/a |
| Full year | |||||||
| FY26 revenue | n/a | $58.66B | $63.23B (43) | $66.17B | $65.4B | $65.8B | +4.1% |
| FY26 EPS | n/a | $1.12 | $1.54 (42) | $1.74 | $1.77 | $1.85 | +20% |
| FY27 revenue | n/a | $64.60B | $73.24B (46) | $91.32B | $76B | $77B | +5.1% |
| FY27 EPS | n/a | $1.48 | $2.18 (45) | $3.44 | $2.50 | $2.70 | +24% |
Source: Intel Q2 2026 earnings release (Jul 23, 2026); Yahoo Finance INTC analysis page (accessed Oct 27, 2026, 5:50 PM ET; number of estimates in brackets); INH Capital estimates.
- Our Q3 and Q4 EPS sit above the Street high; our revenue sits above the Q3 high and inside the Q4 range. Our FY27 EPS of $2.70 sits inside the Street range, 21% below the high.
- Gross margin and segment consensus are not published by public vendors, so we benchmark margin against the guide and Intel's own record. Intel beat its margin guide by an average of 368bp over the last four quarters; our 290bp is about 80% of that.
- Is 44.9% credible? It implies about 62% incremental gross margin on revenue vs Q3 2025, above the top of the 40% to 60% fall-through range the CFO cited on the Q2 call. Holding 44.9% in Q4 implies about 65%. That is our aggressive call: it rests on pricing holding, server mix and 18A yields, and it is where our estimate is most exposed. Every 50bp of Q3 gross margin is about $0.015 of EPS.
Exhibit 1: Intel quarterly revenue and non-GAAP gross margin, with the Q3 2026 guide and our estimate
Revenue in $B (top); non-GAAP gross margin in % (bottom). Q2 2024 to Q2 2026 reported; Q3 2026 guide midpoint (range $15.8-16.8B) and INH estimate.
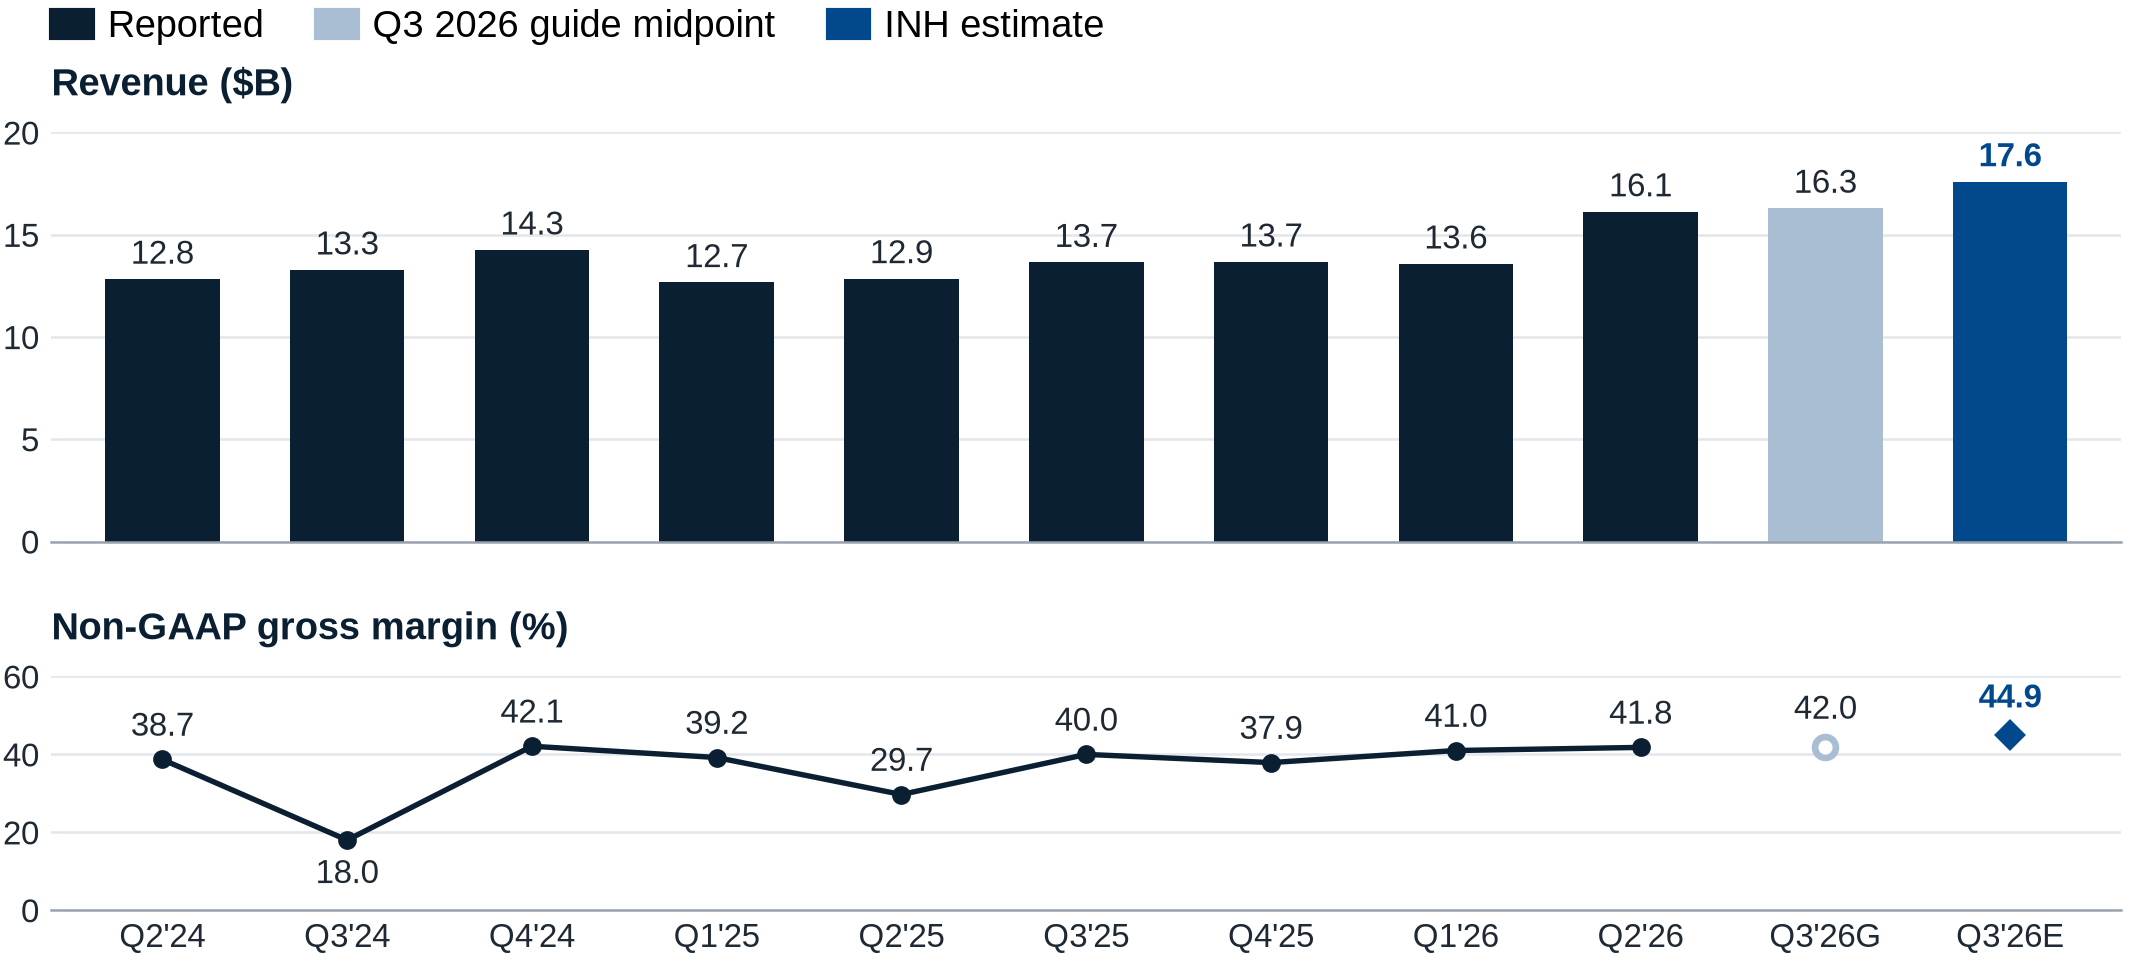
Source: Intel quarterly earnings releases, Form 8-K Ex. 99.1, Q2 2024 to Q2 2026 (SEC EDGAR); Q3 2026 outlook from the Q2 2026 release (Jul 23, 2026); INH Capital estimates. Q3'24 non-GAAP GM includes $3.1B of impairment and accelerated depreciation charges; Q2'25 includes ~$800M of such charges plus ~$200M of one-time period costs (~800bp), per Intel.
Exhibit 2: Our Q3 and Q4 2026 estimates against the full consensus range
Revenue in $B (left); non-GAAP EPS in $ (right). Bars span the lowest to highest published estimate; the line marks the mean.
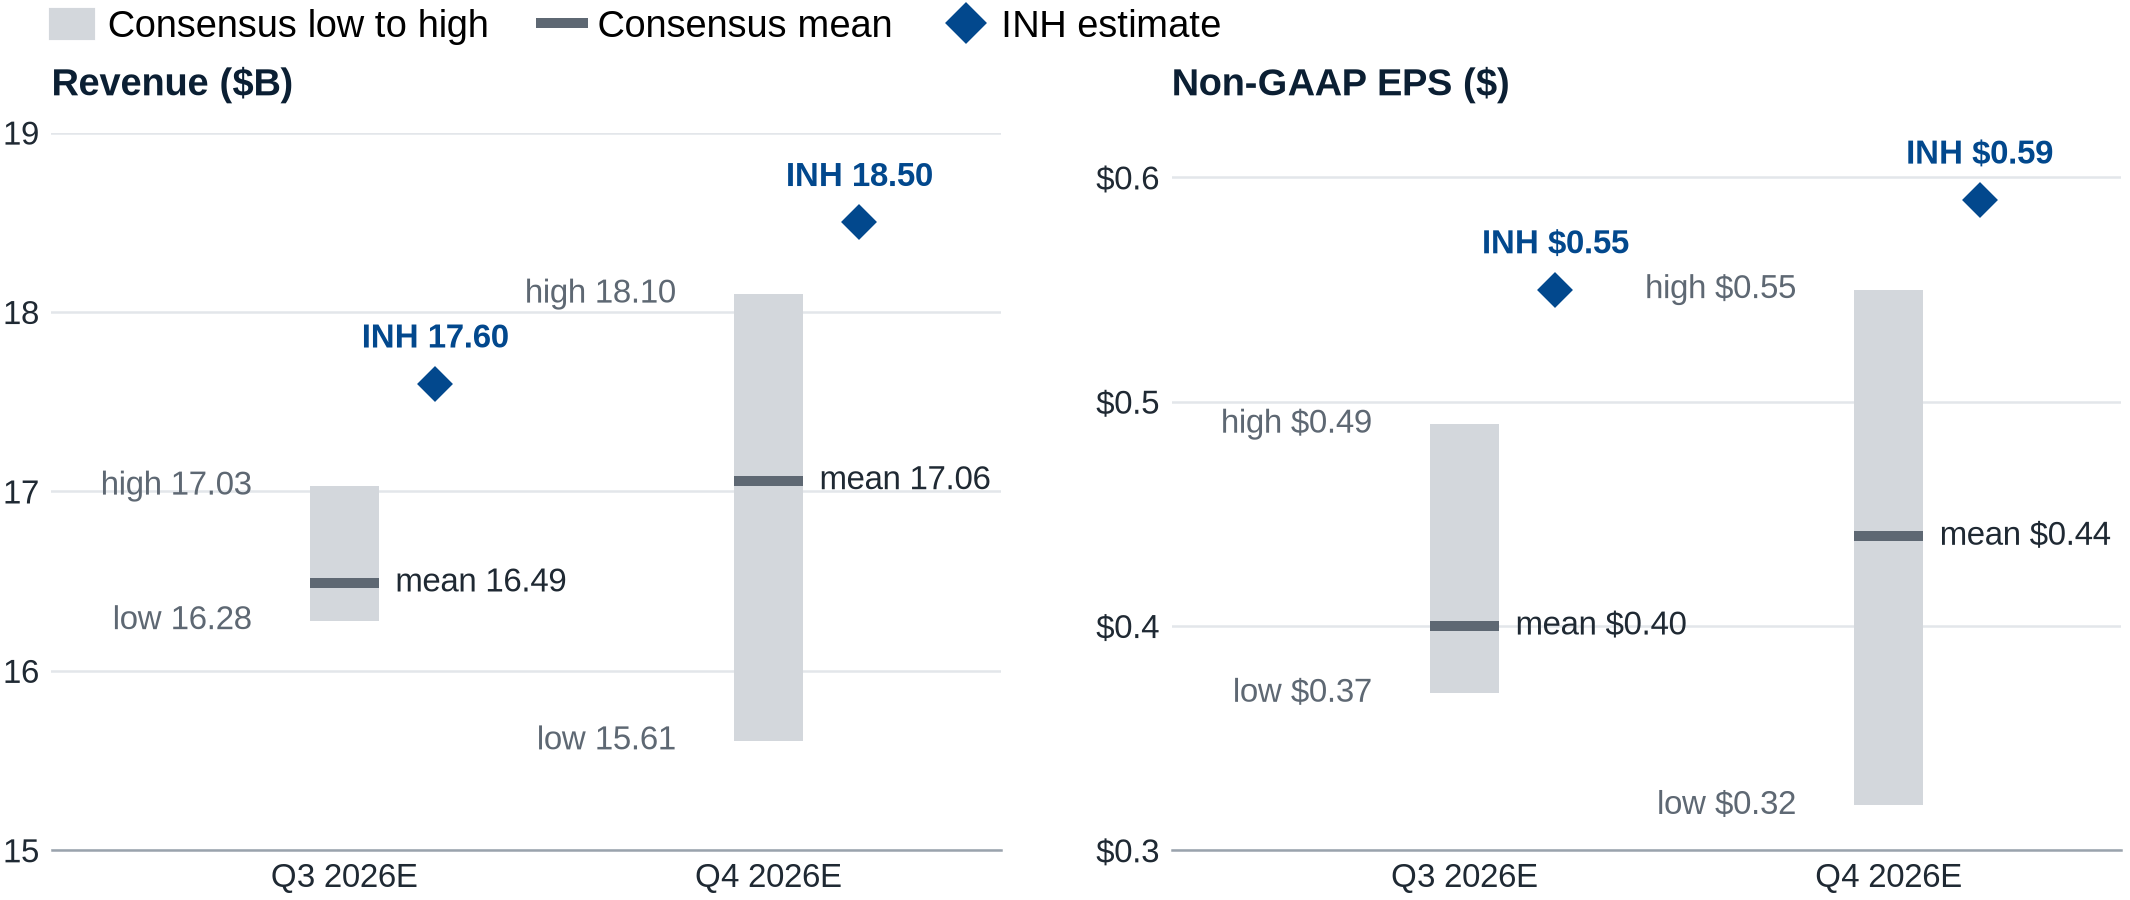
Source: Yahoo Finance INTC analysis page, revenue and earnings estimates (accessed Oct 27, 2026, 5:50 PM ET); INH Capital estimates.
Exhibit 3: Estimate changes: non-GAAP gross margin and DCAI revenue
Non-GAAP gross margin in % (left), Intel guide vs INH Oct 12 and Oct 27 estimates; axis starts at 38%. DCAI revenue in $B (right), reported and INH Oct 27 estimates, with the Oct 12 Q3 estimate marked.
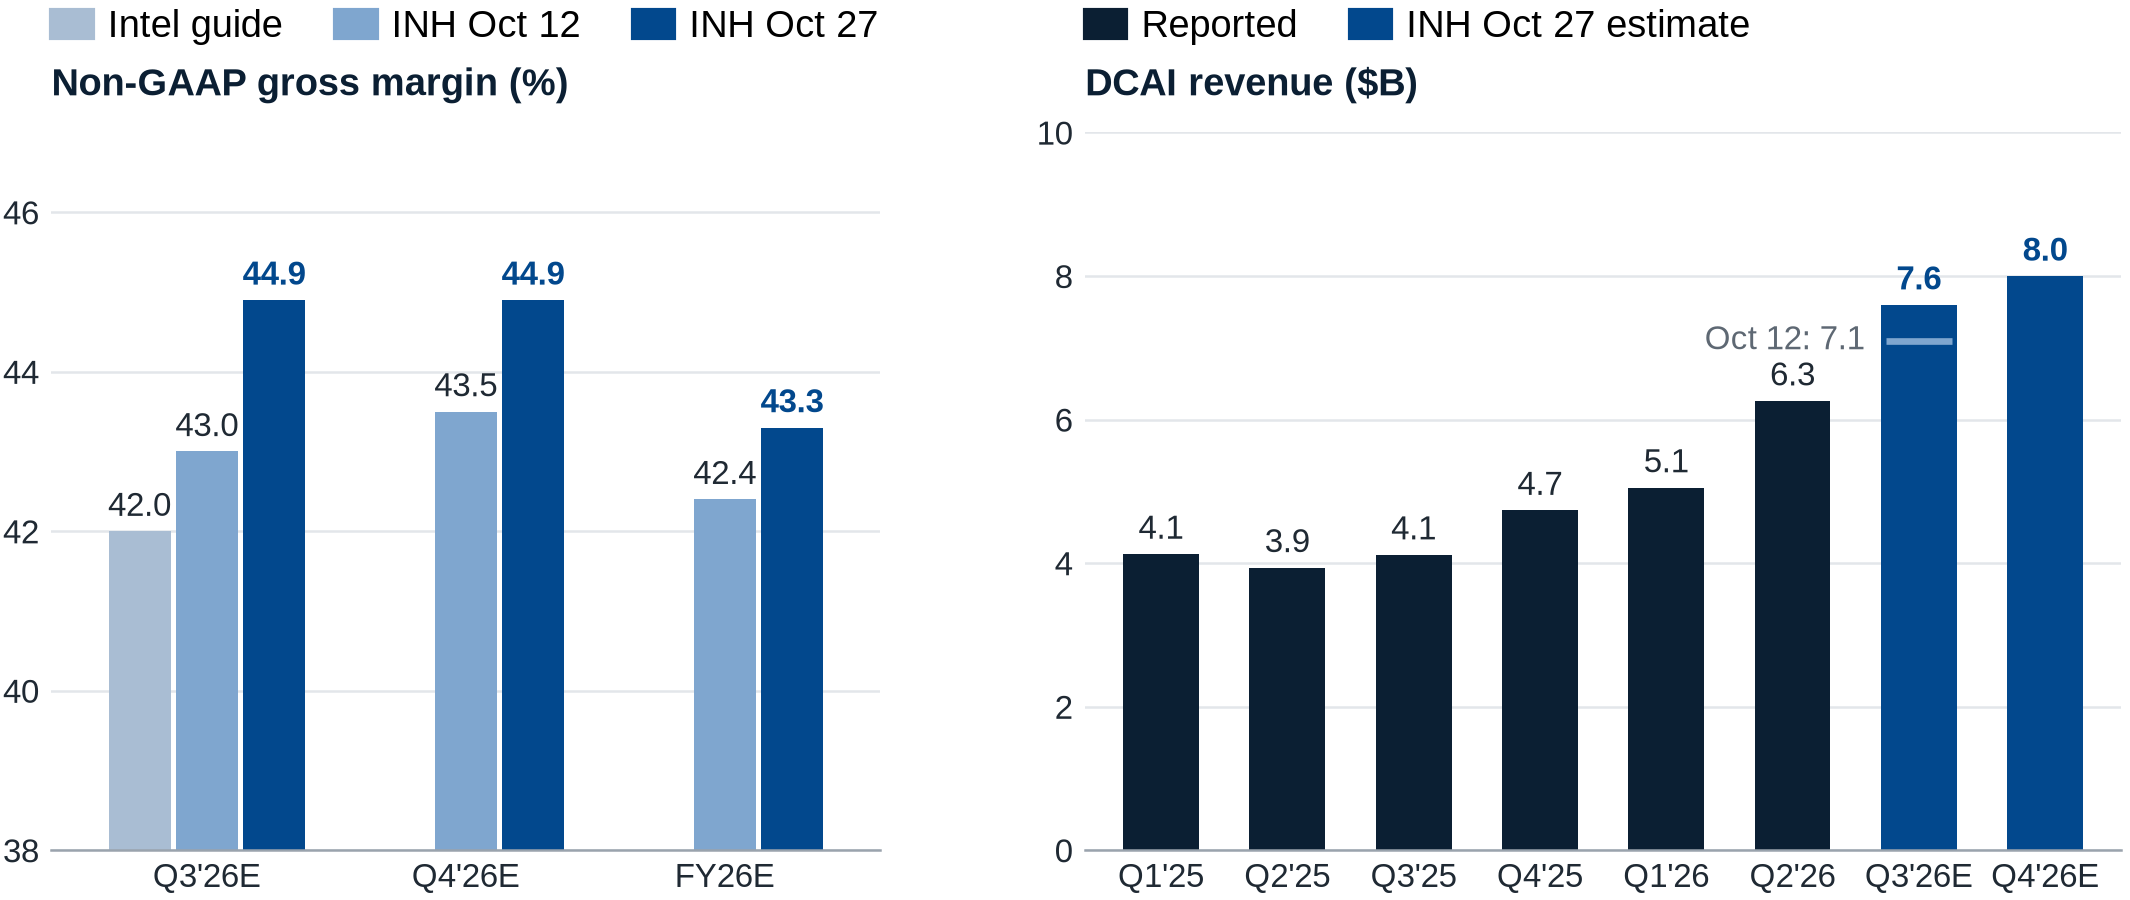
Source: Intel Q2 2026 earnings release (Q3 outlook) and quarterly 8-K Ex. 99.1 segment results, Q1 2025 to Q2 2026 (SEC EDGAR); INH Capital estimates. Consensus gross margin and DCAI estimates are not publicly available.
Consensus revisions (non-GAAP EPS, Yahoo EPS trend)
| Period | Current | 7 days ago | 30 days ago | 60 days ago | 90 days ago | Up / down, last 30 days |
|---|---|---|---|---|---|---|
| Q3 FY26 | $0.40 | $0.40 | $0.39 | $0.39 | $0.39 | 30 / 0 |
| Q4 FY26 | $0.44 | $0.44 | $0.43 | $0.43 | $0.43 | 2 / 1 |
| FY26 | $1.54 | $1.53 | $1.52 | $1.51 | $1.52 | 0 / 0 |
| FY27 | $2.18 | $2.13 | $2.06 | $2.04 | $1.99 | 1 / 0 |
Source: Yahoo Finance INTC analysis page, EPS trend and EPS revisions (accessed Oct 27, 2026, 5:50 PM ET). Yahoo shows two Q3 cuts in the last 7 days but none in the last 30; we show the 30-day figures as published.
- The Street has nudged Q3 and Q4 up by a cent and FY27 up 10% in 90 days, mostly in the last month. Near-term numbers still sit close to the guide. We read that as room for a beat that is driven by price, not volume.
3. How we get to $0.55
| Step | Assumption | EPS impact |
|---|---|---|
| Intel guide | $16.3B revenue, 42.0% GM, $4.30B opex, -$0.05B interest and other, 11% tax, $0.25B NCI, 5.175B shares (Intel guides $0.38) | $0.381 |
| Revenue | $17.6B, $1.3B above the midpoint, at the guided 42% margin | +$0.094 |
| Gross margin: CPU pricing | +150bp from confirmed list and like-for-like price increases | +$0.045 |
| Gross margin: DCAI mix | +70bp as server supply lands late in the quarter and DCAI rises to 43% of revenue | +$0.021 |
| Gross margin: 18A yields | +70bp as Q3 yields run "ahead of targets set in March" | +$0.021 |
| Share count | ~5.30B diluted, incl. ~117M weighted shares from the 242.1M-share raise | -$0.013 |
| INH estimate | Opex $4.30B, other -$0.05B, tax 11% and NCI $0.25B held at guide-consistent levels. Rounds to our $0.55 estimate | $0.549 |
Source: Intel Q2 2026 earnings release, 10-Q, Q2 call and 424B5; INH Capital estimates. Each step is rounded to $0.001, and the column sums exactly.
Exhibit 4: Q3 2026 non-GAAP EPS bridge, Intel guide to our estimate
$ per diluted share. Steps match the Section 3 table. Axis starts at $0.30.
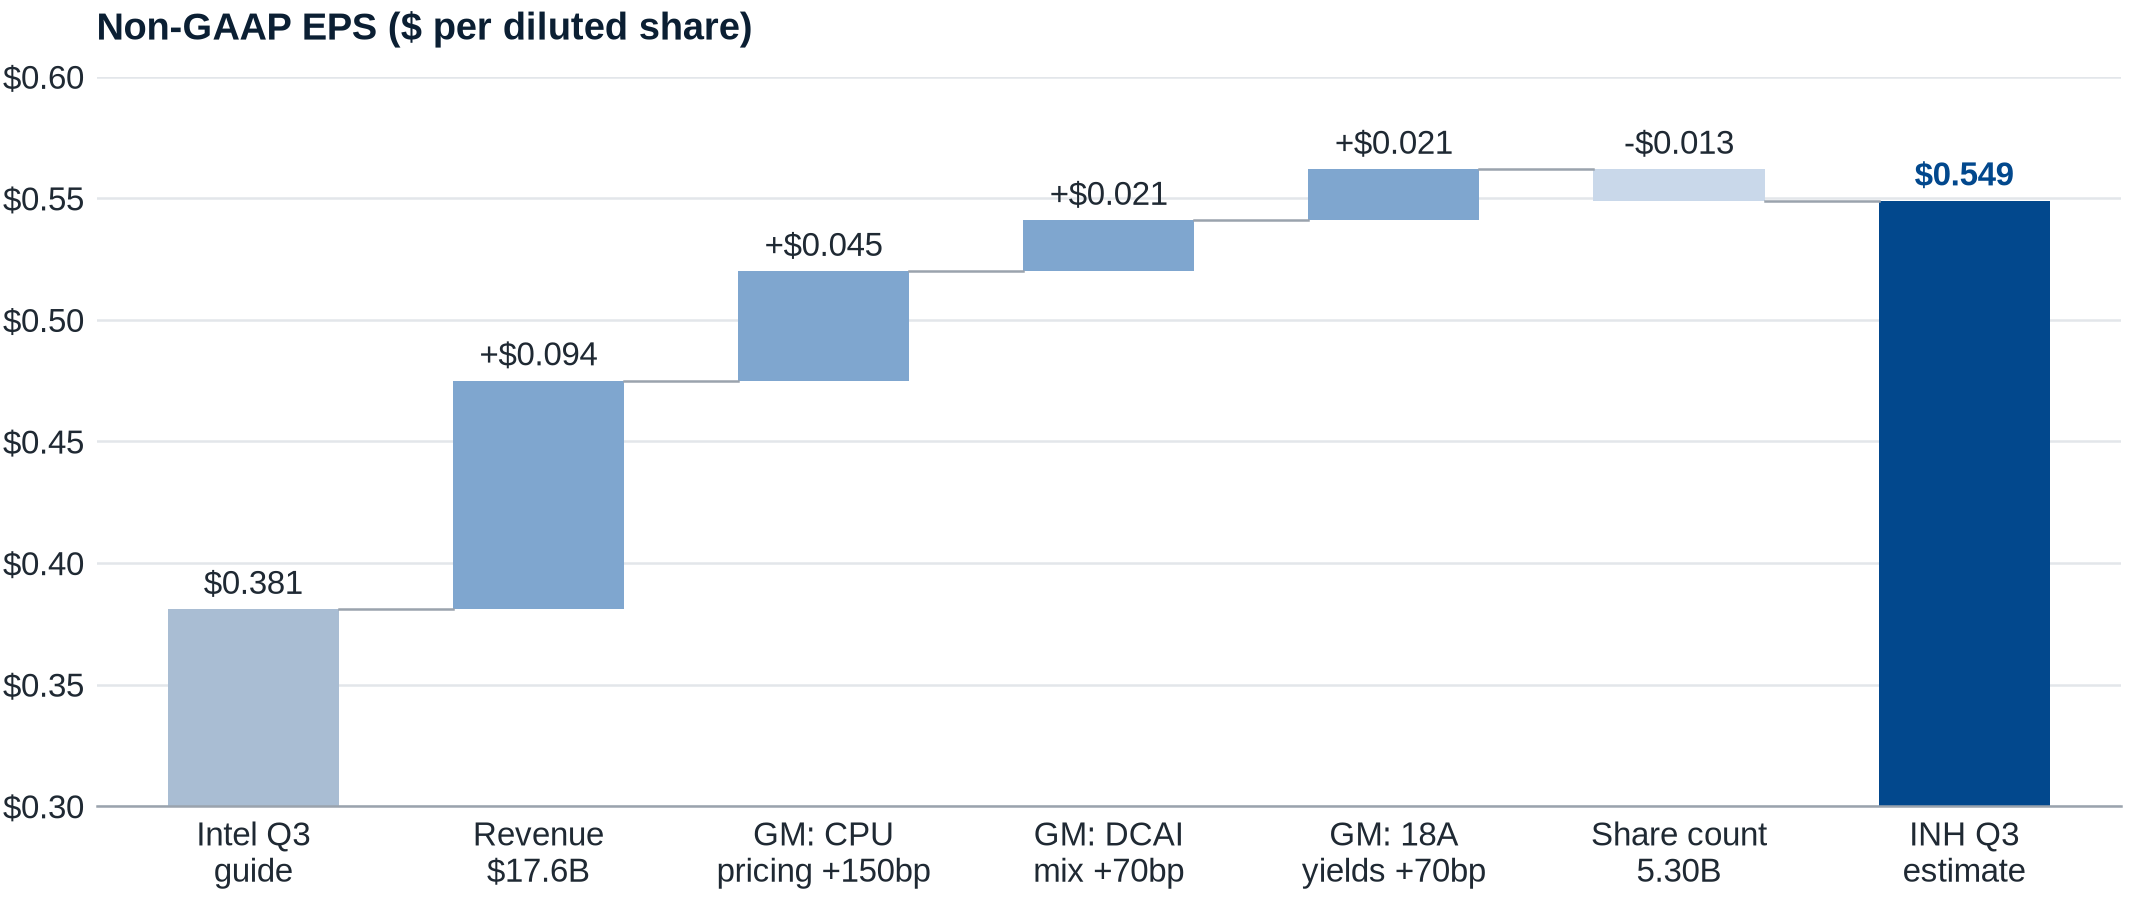
Source: Intel Q2 2026 earnings release and Q3 outlook, Q2 2026 10-Q and 424B5 (SEC EDGAR); INH Capital estimates. Intel guides $0.38; our model reverse-engineers the guide to $0.381. Opex of $4.30B is about half of the 2H opex implied by the ~$16.5B FY26 guide. We give no credit for interest income on the August raise.
- Revenue and margin do all the work. Revenue and margin together are $0.182 of our $0.168 beat vs the guide, partly offset by the larger share count; the 290bp margin step alone is $0.088. We do not count on opex below the run-rate or on interest income from the raise. Every 50bp of Q3 gross margin is about $0.015 of EPS, and every $0.1B of revenue about $0.007.
- Q4 ($0.59). Revenue of $18.5B as late-Q3 supply ships; management has said it "will be behind in the fourth quarter" even after the lift. GM held flat at 44.9%; we do not model a further step up. Opex of $4.35B, which holds FY26 at ~$16.5B. Interest and other at -$0.05B, consistent with Q3. NCI of ~$0.25B. ~5.43B diluted shares.
- Calibration. Q2 printed $0.42 against a $0.20 guide. Over the last four quarters Intel beat its EPS guide by an average of $0.20; over eight quarters, excluding the Q3'24 and Q2'25 impairment charges, the median beat was $0.165. Our +$0.17 Q3 beat vs guide (+$0.168 unrounded vs our $0.381 reconstruction) sits at that median. Revenue of $17.6B is 8.0% above the guide midpoint, close to the 7.8% average revenue beat of the last four quarters. Our 2H26 EPS of $1.14 compares with $0.84 in consensus.
4. Earnings track record
Exhibit 5: Intel guide vs reported results, last 11 quarters
Revenue in $B (top) with the reported figure vs the guide midpoint; non-GAAP EPS in $ (bottom) with the reported figure minus the guide.
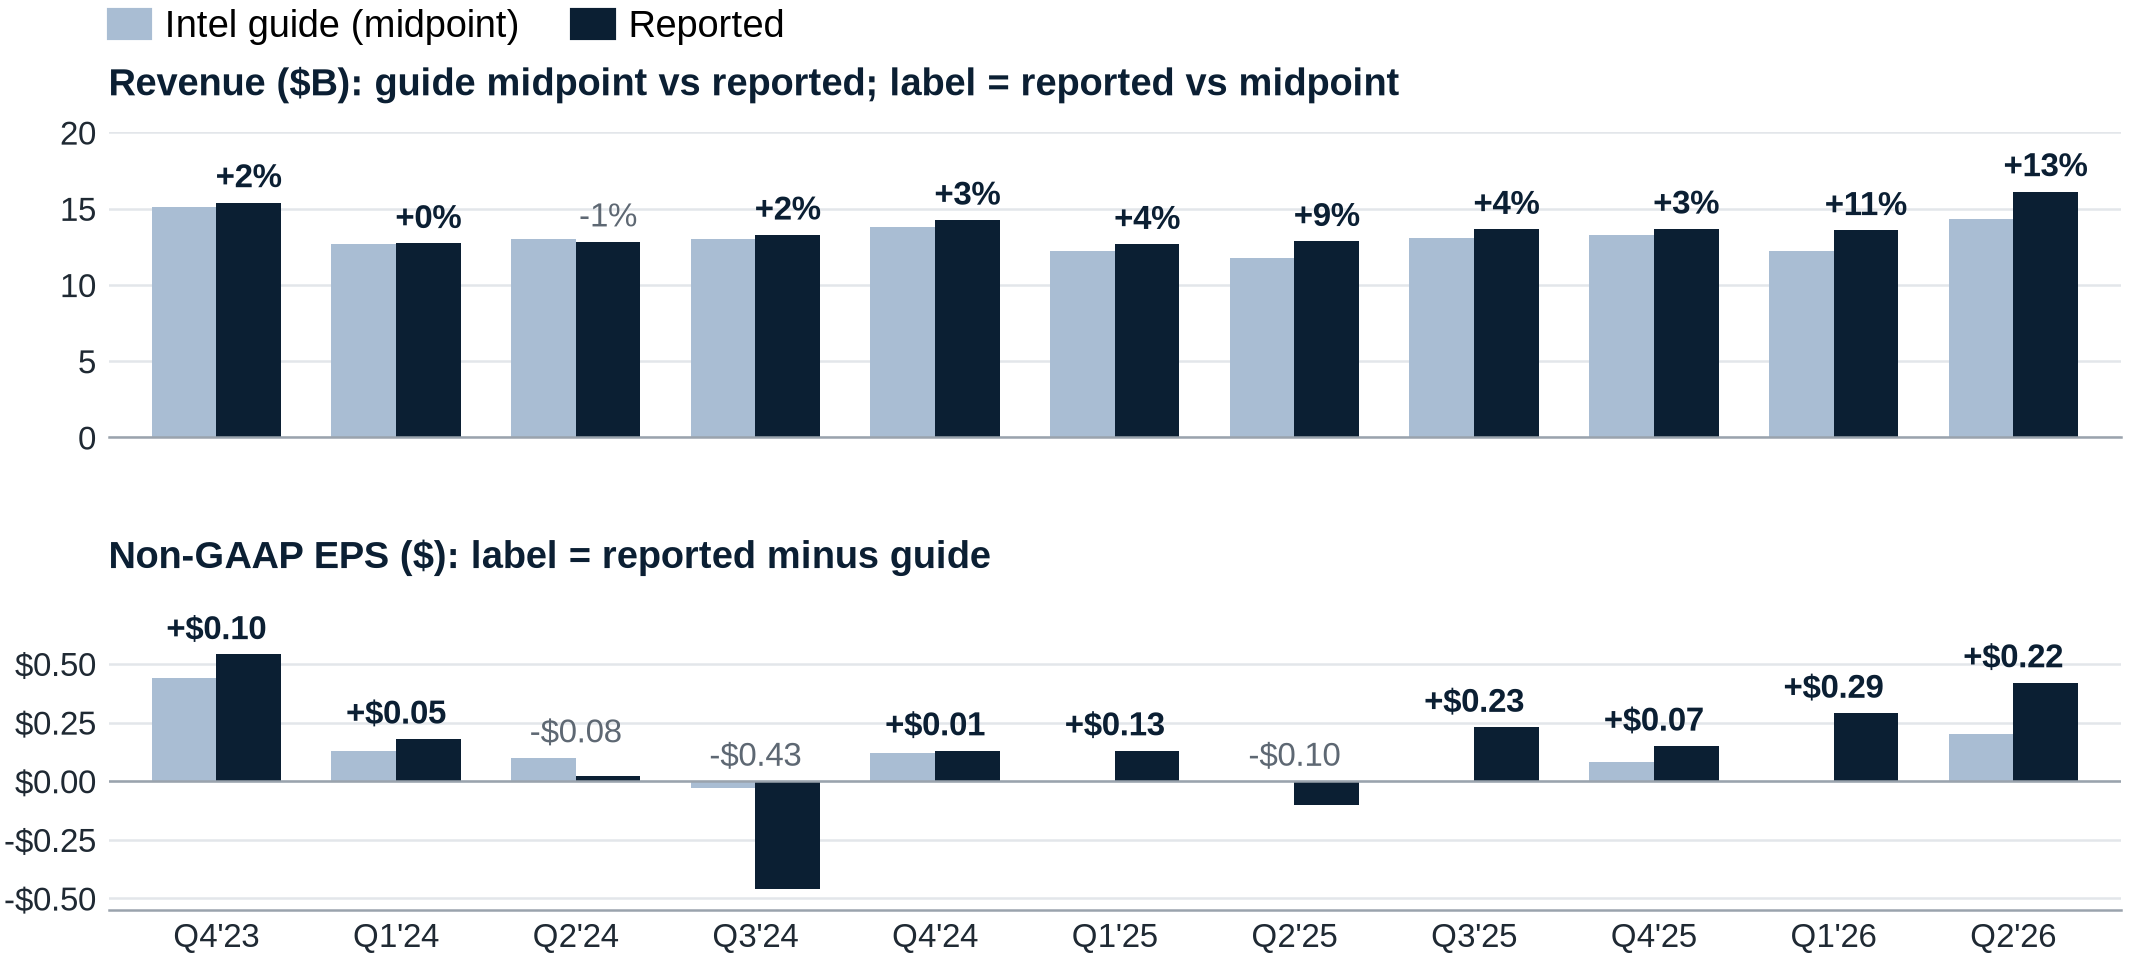
Source: Intel quarterly earnings releases, Form 8-K Ex. 99.1, Q3 2023 to Q2 2026 (guide from the prior quarter's Business Outlook; SEC EDGAR, accessed Oct 12, 2026). Full table in Appendix Table A1.
| Measure (Q4'23 to Q2'26, 11 quarters) | Revenue vs guide midpoint | Non-GAAP GM vs guide | Non-GAAP EPS vs guide |
|---|---|---|---|
| Beats / misses | 10 / 1 | 8 / 3 | 8 / 3 |
| Average result vs guide, all 11 | +4.6% | -75bp | +$0.045 |
| Average result vs guide, last 4 | +7.8% | +368bp | +$0.20 |
| Above the top of the guided range | 4 of 11 | n/a | n/a |
| Largest miss | -1.3% (Q2'24) | -2,000bp (Q3'24, charges) | -$0.43 (Q3'24) |
Source: Intel 8-K Ex. 99.1 earnings releases (SEC EDGAR, accessed Oct 12, 2026); INH Capital calculations.
| Quarter | EPS consensus | Reported | Difference |
|---|---|---|---|
| Q3'25 | $0.01 | $0.23 | +$0.22 |
| Q4'25 | $0.08 | $0.15 | +$0.07 |
| Q1'26 | $0.01 | $0.29 | +$0.28 |
| Q2'26 | $0.22 | $0.42 | +$0.20 |
Source: Yahoo Finance INTC analysis page, earnings history (accessed Oct 27, 2026); reported figures from Intel 8-K Ex. 99.1.
- The last four quarters were all beats, averaging +$0.20 vs guide and +$0.19 vs consensus. Our +$0.17 Q3 beat vs guide is about 85% of the recent average.
- On the Q2 call the CEO called Q2 "the seventh consecutive quarter of exceeding our financial expectations." On reported non-GAAP figures we count Q2'25 as a miss on EPS (-$0.10 vs a $0.00 guide) and margin, because it included charges; Intel's count is on its own basis.
5. Q2 recap: what we got right, what we missed
| What we expected | What Intel reported | Result |
|---|---|---|
| Beat on revenue | $16.13B vs $14.3B guide midpoint; +25% YoY | Right |
| Beat on EPS | $0.42 vs $0.20 guide | Right |
| DCAI up double digits QoQ | $6.26B, +24% QoQ, +59% YoY, ~40% operating margin | Right |
| Margin upside | Non-GAAP GM 41.8% vs 39% guide | Right |
| Capex raised on demand | 2026 above $20B, from ~$18B; 2027 "significantly above" | Right |
| Positive stock reaction | -7.9% next day; -18% to $81.88 by Jul 29 | Missed |
| Packaging revenue by end-2026 | Revenue ramp now 2H27 (CFO, Aug 26) | Missed (timing) |
| Foundry inflection | Loss narrowed $348M QoQ, but external revenue only $293M | Partial |
Source: Intel Q2 2026 earnings release and call; Deutsche Bank Technology Conference (Aug 26, 2026); Yahoo Finance prices.
We were right on the business and wrong on the tape. We size for the reaction, not the print.
6. Foundry funding: the evidence
Our core view is that the stock is priced as if Intel is funding its manufacturing build alone. The public record says customers are already sharing the bill. What follows separates what Intel has said, what has been reported and what we infer.
| Evidence | What it says | Status | Date |
|---|---|---|---|
| Customer prepayments | CFO: "we've had prepays from customers that has enabled us to unlock capacity" | Intel, Q2 call | Jul 23, 2026 |
| Capex gated by commitments | CFO: "we must have pretty significant confidence in our customers, or we wouldn't be putting the POs in place today" | Intel, Q2 call | Jul 23, 2026 |
| Long-term agreements | CEO: "additional strategic customer wins and long-term agreements in Q2" in DCAI | Intel, Q2 call | Jul 23, 2026 |
| Substrate prepayments by Intel | CFO: "putting money up in advance of getting the substrates"; 10-K: supplier arrangements with "large prepayments," particularly substrates | Intel, Q2 call and 2025 10-K | Jul 23, 2026 |
| ~$3B substrate capacity prepaid | Taiwan's Economic Daily News: Intel's long-term prepaid high-end IC substrate capacity estimated at ~$3B, within ~$5B prepaid by three US chipmakers to Unimicron, Kinsus and Nan Ya PCB | Report; industry estimate, not confirmed by Intel | Oct 24, 2026 |
| Glass core substrates | Intel and 3DGS to invest ~$3.3B in a glass core and HDI substrate plant in Odisha, India, over five to six years (Indian government) | Announced by the Indian government | May 29, 2026 |
| 14A PDK 0.9 | CEO: "PDK 0.5 is now complete, and PDK 0.9 is on track for October"; CFO (Aug 26): "you can pretty much now expect us to land in October with that 0.9 PDK"; CEO (Oct 24): "stay tuned we're going to have the 0.9 PDK and then early next year we're going to have 1.0 PDK for volume production" | Intel; release not yet announced | Jul 23 to Oct 24, 2026 |
| Apple | WSJ: Apple and Intel reached a "preliminary agreement" for Intel to make some Apple chips; neither company has confirmed | Report | May 8, 2026 |
| Ohio One | First major structural truss installed; Mod 1 construction still targeted for 2030, operations 2030-31 | Intel | Oct 21, 2026 |
| Classiq | Definitive agreement to acquire quantum software company Classiq; terms not disclosed by Intel; ~$2.3B in cash and stock per Calcalist and Bloomberg; close expected 1H27 | Intel (deal); price is a report | Oct 26-27, 2026 |
Source: Intel Q2 2026 earnings call (Jul 23, 2026); Intel 2025 Form 10-K; Economic Daily News via GMT Eight (Oct 24, 2026); Reuters via The Economic Times (May 29, 2026); Wall Street Journal and Reuters (May 8, 2026); Intel newsroom, CNBC and Axios (Oct 21-22, 2026); Intel press release (Oct 26, 2026); Calcalist and Bloomberg (Oct 27, 2026); CFO remarks at an investor conference (Aug 26, 2026; Source 4); CASPA fireside chat via Wccftech (Oct 26, 2026).
- Apple (INH view). We believe Apple has committed to Intel Foundry and that management is confident in the relationship. This is our expectation, not a confirmed fact. Public reporting has moved from exploratory talks (Bloomberg, May 5) to a preliminary agreement (WSJ, May 8), and published supply chain commentary points to an M-series part on 18A-P and a later phone part on 14A. Intel does not usually name foundry customers. Confirmation on the call, or language such as a committed leading-edge mobile or PC customer, would be the clearest evidence that the investment is being made because customers have signed.
- Ohio One (INH inference). Intel has said since February 2025 that it would accelerate Ohio "if customer demand warrants." The Oct 21 truss milestone, and Senator Husted's comment that a potential partner "could hasten the build-out," are the first signs of movement in a year. Intel has not changed the 2030 timeline. Our inference is that any acceleration will be tied to prepayments or reserved capacity from known customers, because that is the condition management set. We think the market has not priced that Intel is ahead of where the official schedule implies.
- Substrate prepayments. Intel paying suppliers in advance and customers paying Intel in advance are two sides of the same trade: tight back-end capacity is being reserved with cash. We treat the ~$3B figure as an industry estimate. It refers to high-end IC substrates from Taiwanese makers, not specifically glass substrates; we found no public source for a $3B glass substrate prepayment.
- Classiq (INH view). The reported price is about 4% of Intel's ~$52B pro forma cash and short-term investments and about 0.5% of its market cap. It is small, partly paid in stock and long dated. What matters to us is the timing: management chose to announce a discretionary acquisition three days before the print. We read that as confidence in cash generation and in the direction of the balance sheet.
- 14A PDK 0.9 (INH inference). A PDK 0.9 carries near-final design rules and device models, which is the point at which customers move from test chips to product designs and capacity planning. Management has tied the two directly: the CEO said in April that 0.9 "is where customers start to decide which products, how much volume, and capacity we need," and in July that once customers see the 0.9 PDK and the yield, "they're starting to get excited about... how much capacity we can provide them." The CFO added that the step from 0.9 to 1.0 "is not as significant as going from 0.5 to 0.9." Intel committed in Q2 to a 14A high-volume ramp in 2028, with risk production on internal products in 2H27, and said it is ordering tools ahead of that ramp. Our inference is that the October 0.9 milestone, and the 1.0 release planned for early 2027, frame the window in which external 14A customers sign capacity and prepayment terms. Intel has not announced the 0.9 release as of Oct 27. A slip of a few weeks would not change our view; a slip into 2027 would.
7. CPU pricing and demand: the driver behind our margin
| Date | What happened | Magnitude | Status |
|---|---|---|---|
| Early 2026 | An Intel executive confirmed CPU price increases to PC OEMs amid tight supply | Not disclosed | Intel, to CRN |
| Apr 22, 2026 | ODMs report consumer CPU prices up 5-10% and server CPU prices up 10-20% since March; server pricing adjusted Apr 1 | 5-20% | Report (Commercial Times via TrendForce) |
| Jul 3, 2026 | Intel confirmed price increases on select consumer and server CPUs, citing supply chain costs and demand | Xeon 6980P list $12,460 to $13,955 (+12.0%); Core Ultra 7 270K Plus about +16% | Intel, to Tom's Hardware; magnitudes from list prices |
| Jul 23, 2026 | Q2 gross margin upside from "higher ASPs due to mix and pricing actions"; client "like-for-like changes in ASPs" | Q2 GM 41.8% vs 39.0% guide | Intel, Q2 call |
| 2H26 | Industry expects a further round of CPU price increases | ~8-10% | Report (Commercial Times; Yicai) |
Source: CRN (2026; exact date not shown on the page we accessed); TrendForce citing Commercial Times (Apr 22, 2026); Tom's Hardware (Jul 3, 2026); Yicai (Jul 6, 2026); Intel Q2 2026 earnings call (Jul 23, 2026).
- List prices are not transaction prices, and Intel does not disclose ASP changes by product. Q2 was the first quarter with the price increases fully in the numbers; Q3 carries the July list changes. Server is priced per core, so rising core counts lift ASP on top of list changes. The Q2 10-Q shows server ASP up 48% YoY.
| Demand signal | What Intel said | Date |
|---|---|---|
| Demand vs supply | CEO: "Strong demand for our products continue to outpace our growing supply"; CFO: "server CPU demand continues to far outpace available supply" | Jul 23, 2026 |
| Server outlook | CFO: "Our outlook for server CPU demand has improved again since our last earnings report," with "strong double-digit unit growth for the industry this year and next, with momentum extending into 2028" | Jul 23, 2026 |
| AI workloads | CEO: "As AI expands from training to inference and increasingly to agentic and multi-agent systems, general purpose server CPU density continue to increase"; CFO: CPU to GPU ratio "almost in parity" and could "skew more to CPUs on a unit basis" | Jul 23, 2026 |
| Product tightness | CFO: "Granite Rapids is extremely tight"; CEO: Q2 year-over-year server growth "was the strongest on record" | Jul 23, 2026 |
| Supply into Q4 | CFO: "we will not catch up. We will be behind in the fourth quarter"; expects to under-supply in 2026 and "probably" 2027 | Jul 23 and Aug 26, 2026 |
| Customer signals | CFO: capex raised "due to strong customer demand signals"; long-term agreements give the "signal to be able to forecast out what the outlook looks like for the next few years" | Jul 23, 2026 |
Source: Intel Q2 2026 earnings call (Jul 23, 2026; Source 3); CFO remarks at an investor conference (Aug 26, 2026; Source 4).
- Our read. Pricing power follows from the supply gap. Intel raised list prices in July while saying it cannot meet server demand through Q4, and supply chain commentary points to a further round of increases in 2H26. Server ASP rose 48% YoY in Q2. We think the Street still models Q3 and Q4 near the guide and does not yet carry the price increases through the gross margin line.
8. Three things that move the stock
1. A beat with sequential growth on improving supply and pricing
- Supply linearity is "more skewed towards the end of Q3 and into Q4, especially for servers."
- Q3 quarter-to-date 18A yields were "trending ahead of targets set in March."
- We want revenue at or above $16.8B, gross margin of 43% or more, DCAI up QoQ, and a Q4 guide of $18.0B or more.
2. Capex tied to committed customers
- 2026 capex was raised to more than $20B from ~$18B; 2027 will be "significantly above" 2026, with tooling up 40% in 2026.
- We want a 2027 framework tied explicitly to customer commitments, the size and count of customer prepayments, and confirmation that the 14A PDK 0.9 has reached external customers, as guided for October, or a firm date before year end.
3. Foundry losses keep narrowing
- Q2 Foundry revenue was $5.8B (+31% YoY); the operating loss was $2.1B, $348M better QoQ.
- EMIB-T has a "growing backlog," with customer ramps in 2027. Breakeven is targeted for end-2027 and could slip into 2028.
- We want a loss below $2.09B and a quantified EMIB-T backlog.
Source: Intel Q2 2026 earnings release and call; Deutsche Bank Technology Conference (Aug 26, 2026).
Exhibit 6: Segment revenue and operating margin, Q1 2025 to Q2 2026, with our Q3 estimates
Revenue in $B (top) and operating margin in % (bottom) for CCG/CCPG, DCAI and Intel Foundry. Q3 2026E shows INH revenue estimates for CCPG and DCAI; we estimate a Foundry operating loss of $1.9B and do not model Foundry revenue.
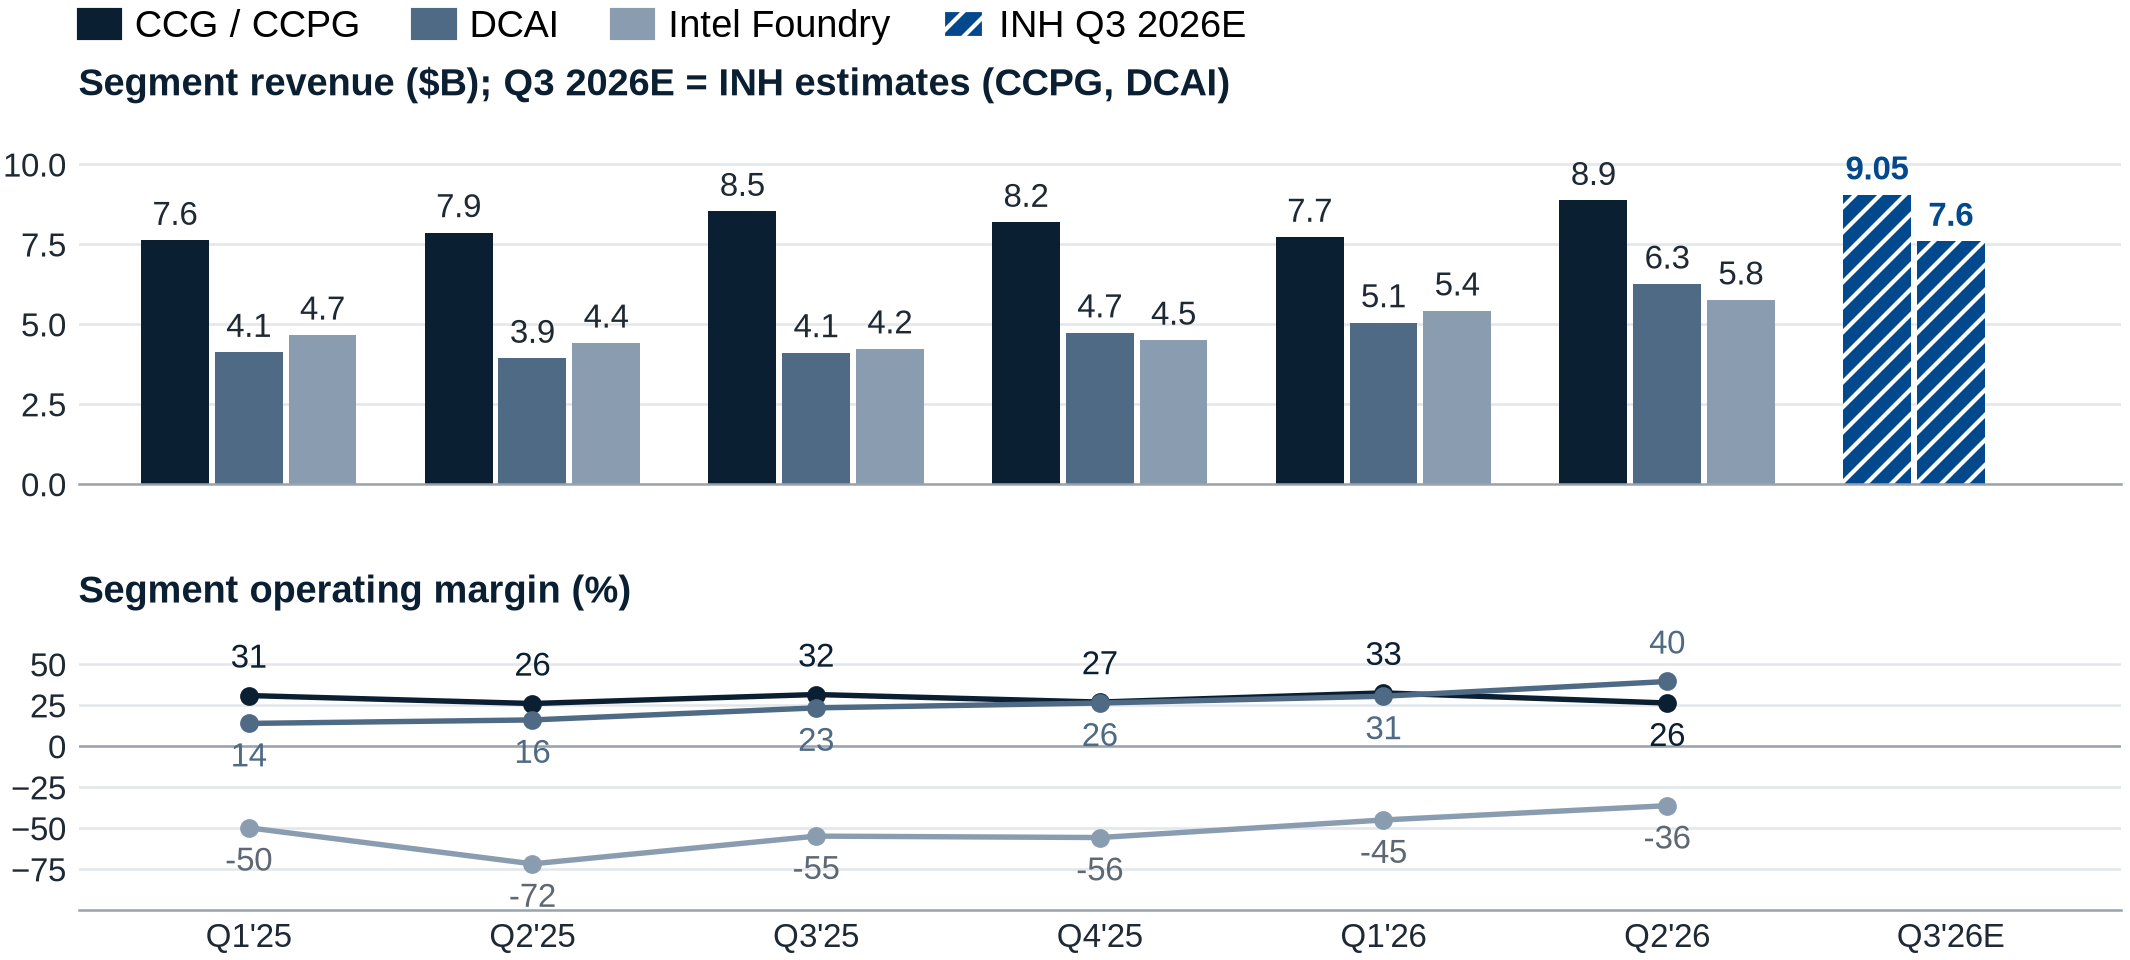
Source: Intel quarterly earnings releases, Supplemental Operating Segment Results, Q1 2025 to Q2 2026 (SEC EDGAR); INH Capital estimates. CCG was renamed CCPG in Q2 2026. Full table in Appendix Table A3.
- DCAI path. $7.6B in Q3 and $8.0B in Q4 put FY26 DCAI at $26.9B, +59% YoY, after +59% YoY in Q2. Intel guided "strong double-digit unit growth" for the server industry this year and next, and says the market prices on ASP per core. We model FY27 DCAI at $34.6B, +29%: supply growth on Intel 3 plus pricing, with no share gain assumed.
- What offsets it. Intel expects PC consumption down low double digits in 2026, and we model CCPG roughly flat in FY27. A weaker PC market is the main risk to our FY27 revenue; DCAI mix is the main support for our FY27 gross margin of 45.5%.
9. Packaging: the nearest foundry revenue
| Deals | Our revenue framing | Public evidence today | Timing on Intel's framing |
|---|---|---|---|
| 1 | $1-3B annual run-rate | The Information reports Google booked Intel packaging for 3M+ TPUs in 2028; industry reports say Google's next TPU (HumuFish) relies on EMIB-T; not confirmed by Intel or Google | Revenue ramp in 2H27 |
| 2 | Multi-billion run-rate | CNBC named Amazon and Cisco as packaging customers; not confirmed by Intel | Run-rate business in 2028 |
| 3+ | $10-20B+ by 2028-30 | Reports that a GPU maker is evaluating Intel's 3D packaging for 2H28; not confirmed | "Hitting its stride" in 2029 |
Source: Deutsche Bank Technology Conference (Aug 26, 2026); Tom's Hardware (Jun 10 and Jul 15, 2026); TrendForce (Oct 22, 2026); CNBC (Apr 30 and May 8, 2026); INH Capital estimates.
- Google and EMIB-T (reported). Industry reports since July say Google's ninth-generation TPU variant HumuFish will use EMIB-T, with mass production targeted for 1H28, and that a second variant, TriggerFish, will also use EMIB-T from 2H28. On Oct 22, TrendForce reported supply chain checks that HumuFish remains "100%" committed to EMIB-T despite speculation about a switch. Supply chain commentary in late October suggests a three-week design revision could move HumuFish tape-out to January 2027. None of this is confirmed by Google or Intel.
- Yields: what is public. Intel said on Jul 23 that EMIB-T "yield and reliability are hitting targets." Intel does not publish packaging yield figures. Reported figures refer to substrate yields at suppliers, not Intel's assembly, and they conflict: TrendForce (Sep 23) reported EMIB substrate yields rising from ~30% in 2Q26 to ~45% in 3Q26, with supplier targets of 50% in 4Q26 and 60% in 1Q27; TrendForce (Oct 22) reported ~35% for EMIB-T substrates in 3Q26 against a 50% year-end target. Supply chain commentary suggests the root cause has been identified, that Intel adjusted its substrate electroplating process, and that Ibiden, Unimicron and Shinko are working on the ramp. We treat all of these as unverified.
- Economics. The CFO frames packaging at "multiple U.S. billion dollars per customer per year," at ~40% gross and ~30% operating margin. Two or three customers at that rate reach our top rung. Intel does not announce foundry customers.
10. Our thesis in four points
- The CPU shortage is supply, not demand. The Q2 10-Q says server demand exceeded supply and that industry-wide constraints persist into next year. The CFO expects to under-supply in 2026 and "probably" in 2027.
- Pricing power on TCO. Server ASP rose 48% YoY in Q2. Intel confirmed price increases on select Core and Xeon SKUs in July. Xeon 6 is the host CPU in NVIDIA DGX Rubin NVL8.
- A credible #2 while TSMC is capacity-limited. TSMC's CEO said in June that "it will be a long time before we can meet customer demand." EMIB-T removes the interposer. The 14A PDK 0.9 was guided to external customers for October, with PDK 1.0 in early 2027, risk production in 2H27 and volume in 2028. We view 0.9 as the step that lets customers commit designs and capacity to 14A.
- Customers are funding the build. Intel has disclosed customer prepayments and says capex follows commitments. We believe Apple has committed to Intel Foundry and that Ohio One's pace will follow reserved capacity. The market treats Intel's capex as a cost; we think a growing share of it is pre-sold.
Source: Intel Q2 2026 10-Q and earnings call; Q1 2026 earnings release and call; CASPA fireside chat via Wccftech (Oct 26, 2026); Deutsche Bank Technology Conference (Aug 26, 2026); Tom's Hardware; INH Capital views.
11. Scenarios
Exhibit 7: Annual non-GAAP EPS: reported, consensus and our estimates
$ per diluted share, fiscal years ending December. Our $175 PT is 65x FY27E EPS of $2.70.
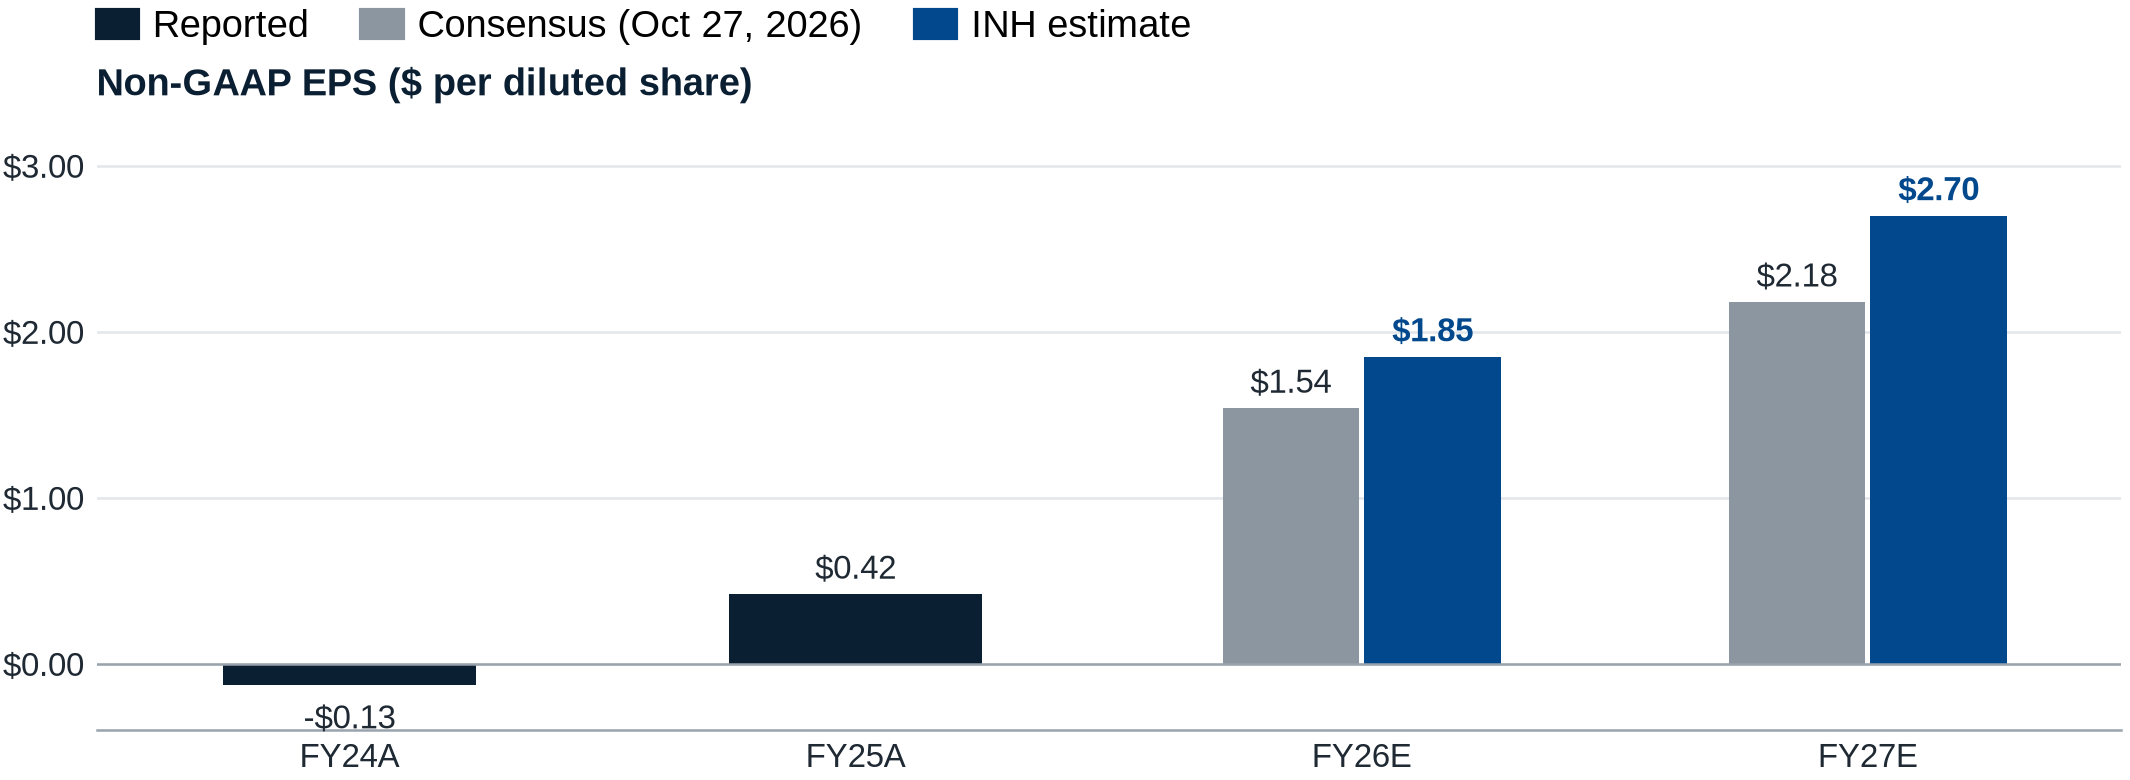
Source: Intel Q4 2024 and Q4 2025 earnings releases (SEC EDGAR); Yahoo Finance INTC analysis page (accessed Oct 27, 2026); INH Capital estimates.
| Case | FY26 revenue | FY26 EPS | FY26 GM | FY27 revenue | FY27 EPS |
|---|---|---|---|---|---|
| Base: beat and raise on price | $60-62B | $1.25-1.40 | 40.5-41.5% | $68-72B | $1.80-2.10 |
| Bull: price plus supply and operating leverage | $64-68B | $1.65-2.00 | 42-44% | $75-82B | $2.50-3.20 |
| Consensus (Oct 27) | $63.23B | $1.54 | n/a | $73.24B | $2.18 |
| Consensus (Oct 12) | $63.10B | $1.52 | n/a | $72.41B | $2.08 |
| INH estimate | $65.8B | $1.85 | 43.3% | $77B | $2.70 |
Source: Yahoo Finance consensus and EPS trend (accessed Oct 12 and Oct 27, 2026); INH Capital estimates.
- Our estimates sit in the bull band on every line, and our Q3 margin already assumes some 18A yield benefit. Full 18A margin accretion is still ahead: Panther Lake and Granite Rapids remain below the corporate-average margin, and the CFO expects both to move above it as 18A yields improve.
12. Valuation and price target
| Multiple at $93.74 (Oct 27 close) | On consensus | On INH estimates | At the $175 PT, on INH |
|---|---|---|---|
| P/E, FY26 | 60.9x | 50.7x | 94.6x |
| P/E, FY27 | 43.0x | 34.7x | 64.8x |
| EV / sales, TTM | 8.7x | n/a | n/a |
| EV / sales, FY26 | 7.8x | 7.5x | n/a |
| EV / sales, FY27 | 6.7x | 6.4x | n/a |
| Price / book (pro forma for the August offering) | 4.5x | n/a | n/a |
Source: Nasdaq prices (Oct 27 close); Intel Q2 2026 10-Q and earnings release (balance sheet at Jun 27, 2026); 424B5 and offering 8-K (Aug 2026); Yahoo Finance consensus (Oct 27, 2026); INH Capital calculations. EV = market cap of $495.4B plus $50.5B of debt less $29.7B of cash and short-term investments and $22.6B of net offering proceeds = $493.6B. Book value = $87.5B Intel stockholders' equity at Jun 27 plus $22.6B net offering proceeds. The pending Classiq acquisition is excluded.
- PT $175: 65x our FY27E EPS of $2.70. Our FY27E is the Q4 26E run-rate ($2.36) plus ~14% growth. The PT is 80x consensus FY27, which is why the call depends on estimates moving toward ours and on the market paying for customer-funded capacity.
- Upside: +86.7% from the $93.74 Oct 27 close. The S&P Global Street range is $80 to $200, with a mean of $117.71 and a median of $112.
| Company | Forward P/E | EV / sales (TTM) | Price / book | YTD price change | 1-year price change |
|---|---|---|---|---|---|
| Intel (INTC) | 53.7x | 9.0x | 5.2x | +154.0% | +137.1% |
| AMD | 50.4x | 21.9x | 12.9x | +161.6% | +115.8% |
| NVIDIA (NVDA) | 18.0x | 17.3x | 22.8x | +16.9% | +13.8% |
| TSMC (TSM) | 20.3x | 11.7x | 8.7x | +43.8% | +46.5% |
| Qualcomm (QCOM) | 19.9x | 4.6x | 6.9x | +7.7% | -1.9% |
| Broadcom (AVGO) | 19.7x | 18.7x | 15.8x | -1.1% | -5.4% |
Source: stockanalysis.com statistics pages (S&P Global Market Intelligence data; forward P/E, EV/sales and price/book as displayed Oct 27, 2026, ~5:55 PM ET); price changes are INH calculations from Nasdaq daily closes (Dec 31, 2025 and Oct 27, 2025 to Oct 27, 2026). Vendor multiples use the vendor's own forward period and book value, so the INTC row differs from our table above.
- INTC trades at a premium to every large-cap peer except AMD on forward earnings, and at a discount to all but Qualcomm on sales. The premium is for earnings that have not yet arrived.
Exhibit 8: INTC price to sales (TTM) and price to book, quarter-end, Q1 2021 to Q2 2026, and at the Oct 27 close
Multiples at fiscal quarter-end closes; Oct 27 uses TTM revenue to Q2 2026 and pro forma book value.
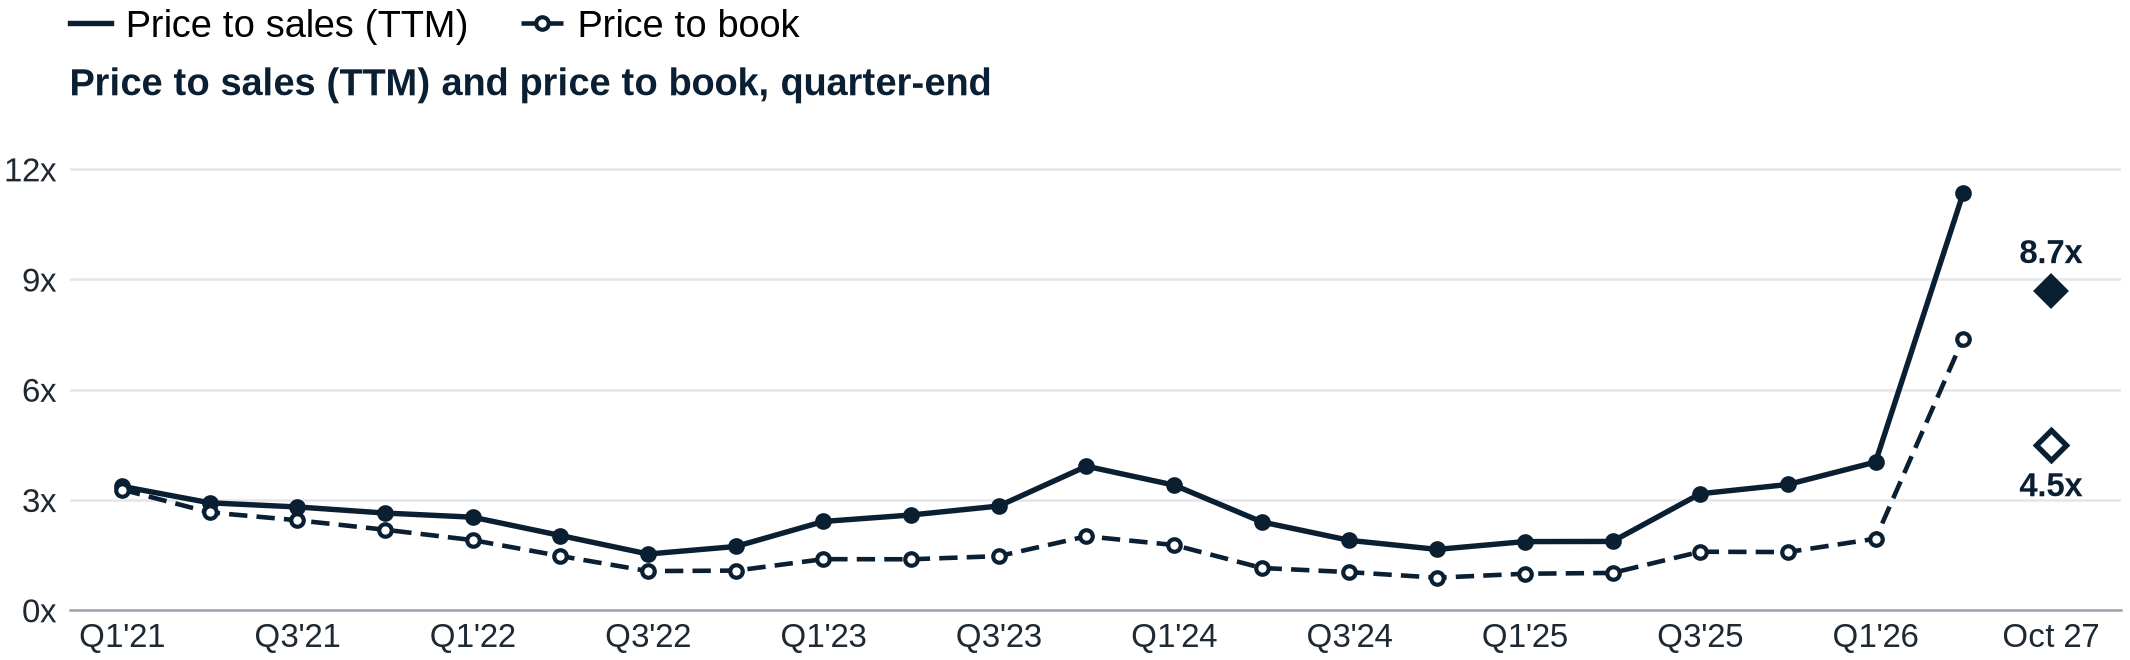
Source: SEC EDGAR XBRL company facts for Intel (revenue, Intel stockholders' equity, cover-page shares; accessed Oct 12, 2026); Nasdaq daily closes; INH Capital calculations. Forward P/E history is omitted: historical consensus is not publicly verifiable.
- Five-year range at quarter-ends: price to sales 1.5x to 11.4x (median 2.6x), price to book 0.9x to 7.4x (median 1.5x). INTC trades at about three times its five-year median on both. The multiples only work if FY27 EPS lands near our number.
13. Event risk and positioning
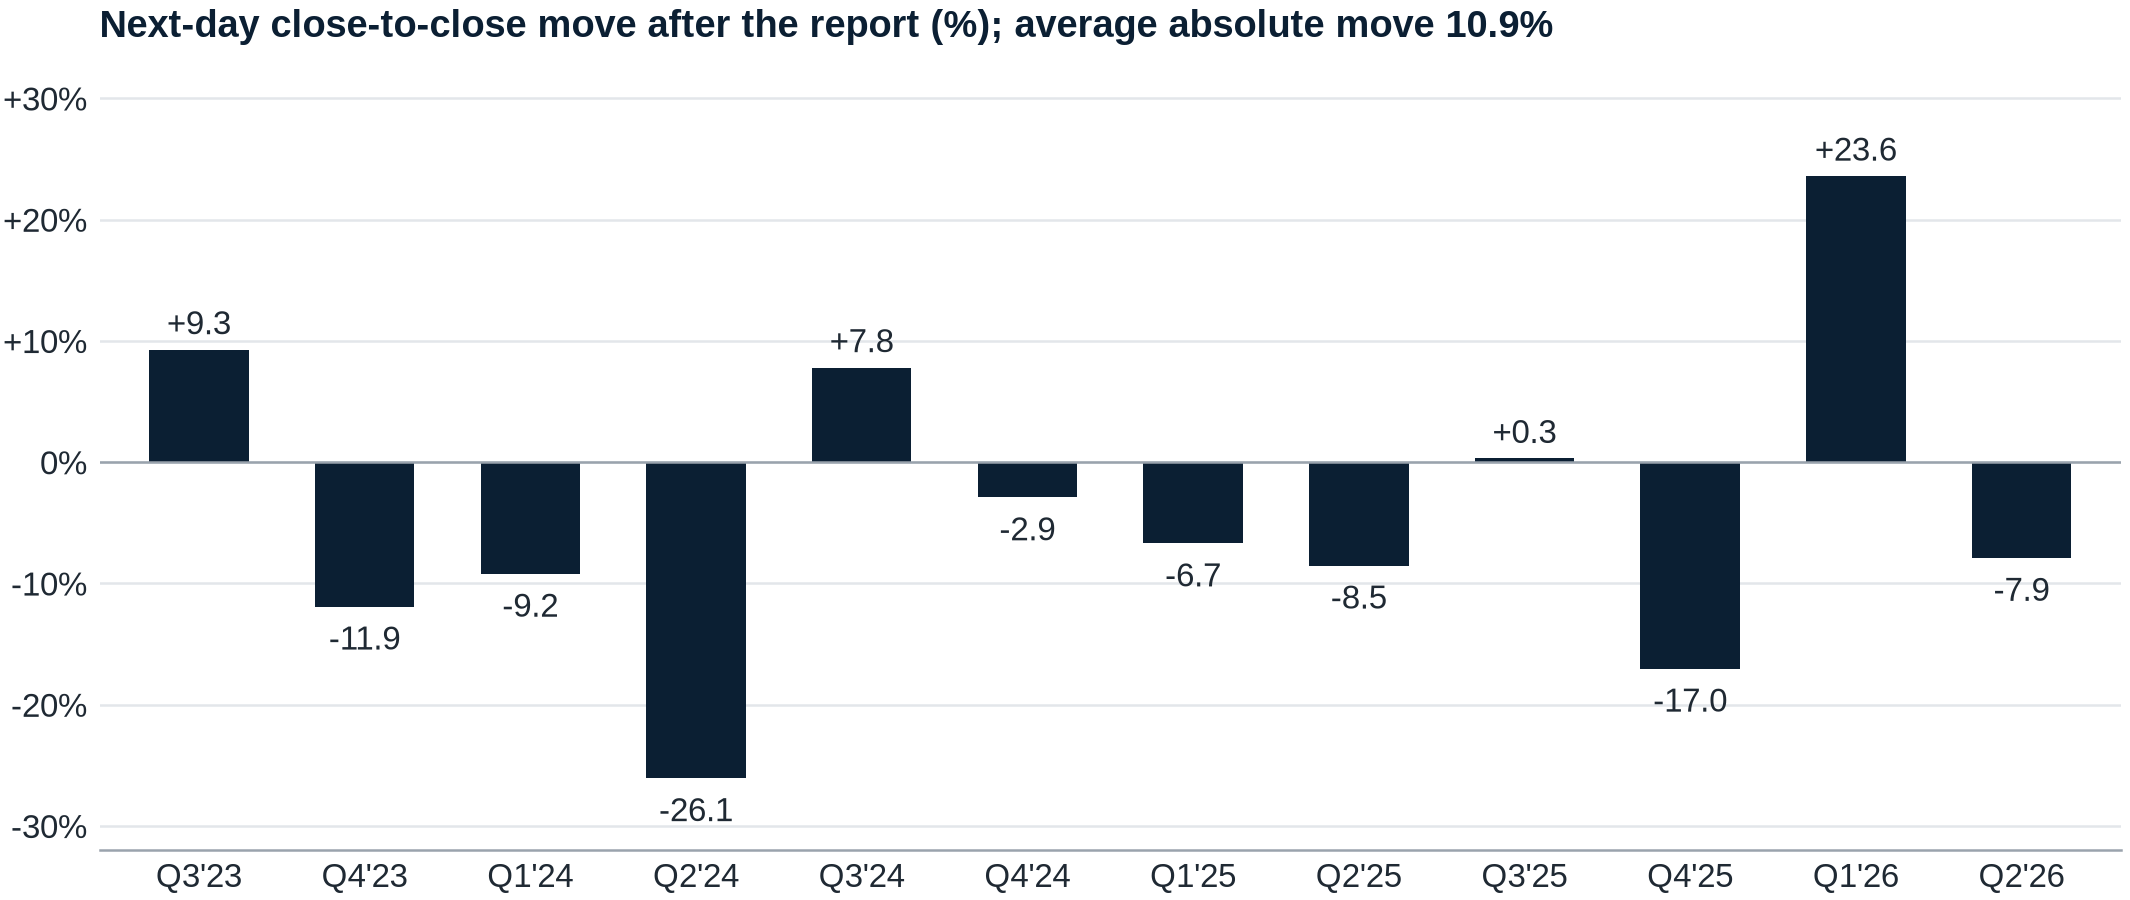
Exhibit 9: INTC next-day move after each of the last 12 earnings reports
Close on the report day to the next day's close, %. All 12 reports were after the close.
Source: Nasdaq INTC daily closes (accessed Oct 12, 2026); report dates from Intel 8-K filing dates (SEC EDGAR); INH Capital calculations.
- History: average absolute move 10.9% over 12 reports (12.2% over the last 4); median 8.9%. Up 4 times, down 8. Largest: -26.1% (Aug 2, 2024), +23.6% (Apr 24, 2026), -17.0% (Jan 23, 2026).
- Options: the Oct 30 at-the-money straddle ($94 strike) closed at an $8.85 mid on Oct 27, or 9.4% of the $93.74 close, covering three sessions. Netting out two normal sessions using the Nov 6 straddle ($10.63) leaves an implied move for the print of about 8.1% (INH calc). Both are below the 10.9% historical average.
- The stock fell after three of the last five EPS beats vs guide. A beat alone has not been enough; the guide and the customer story have to clear the Street.
| Positioning (context, not INH's view) | Value | As of |
|---|---|---|
| Short interest | 148.5M shares (-11.2% vs 167.2M on Sep 30) | Oct 15 settlement |
| Short interest, % of shares outstanding | 2.8% (of 5,285.07M) | Oct 15 |
| Short interest, % of float | 3.1% (of 4.81B float per stockanalysis) | Oct 15 |
| Days to cover | 1.5 | Oct 15 |
| Analyst ratings (S&P Global, 47) | 14 Buy or Strong Buy, 32 Hold, 1 Sell or Strong Sell; consensus "Buy" | Oct 2026 |
| Analyst ratings (Nasdaq, 35 brokers) | Mean rating "Hold"; mean PT $113.53 across 17 targets ($85 to $155) | Oct 27, 2026 |
| Street price target (S&P Global) | Mean $117.71; median $112; range $80 to $200 | Oct 27, 2026 |
Source: Nasdaq INTC short interest (FINRA settlement data) and analyst research pages (accessed Oct 27, 2026); stockanalysis.com forecast and statistics pages (S&P Global Market Intelligence; accessed Oct 27, 2026); INH Capital calculations.
- Short interest fell into the print, and two-thirds of the Street rates the stock Hold. The mean PT sits 26% above the price. A beat and raise with customer evidence has room to move ratings.
14. Stock performance and levels
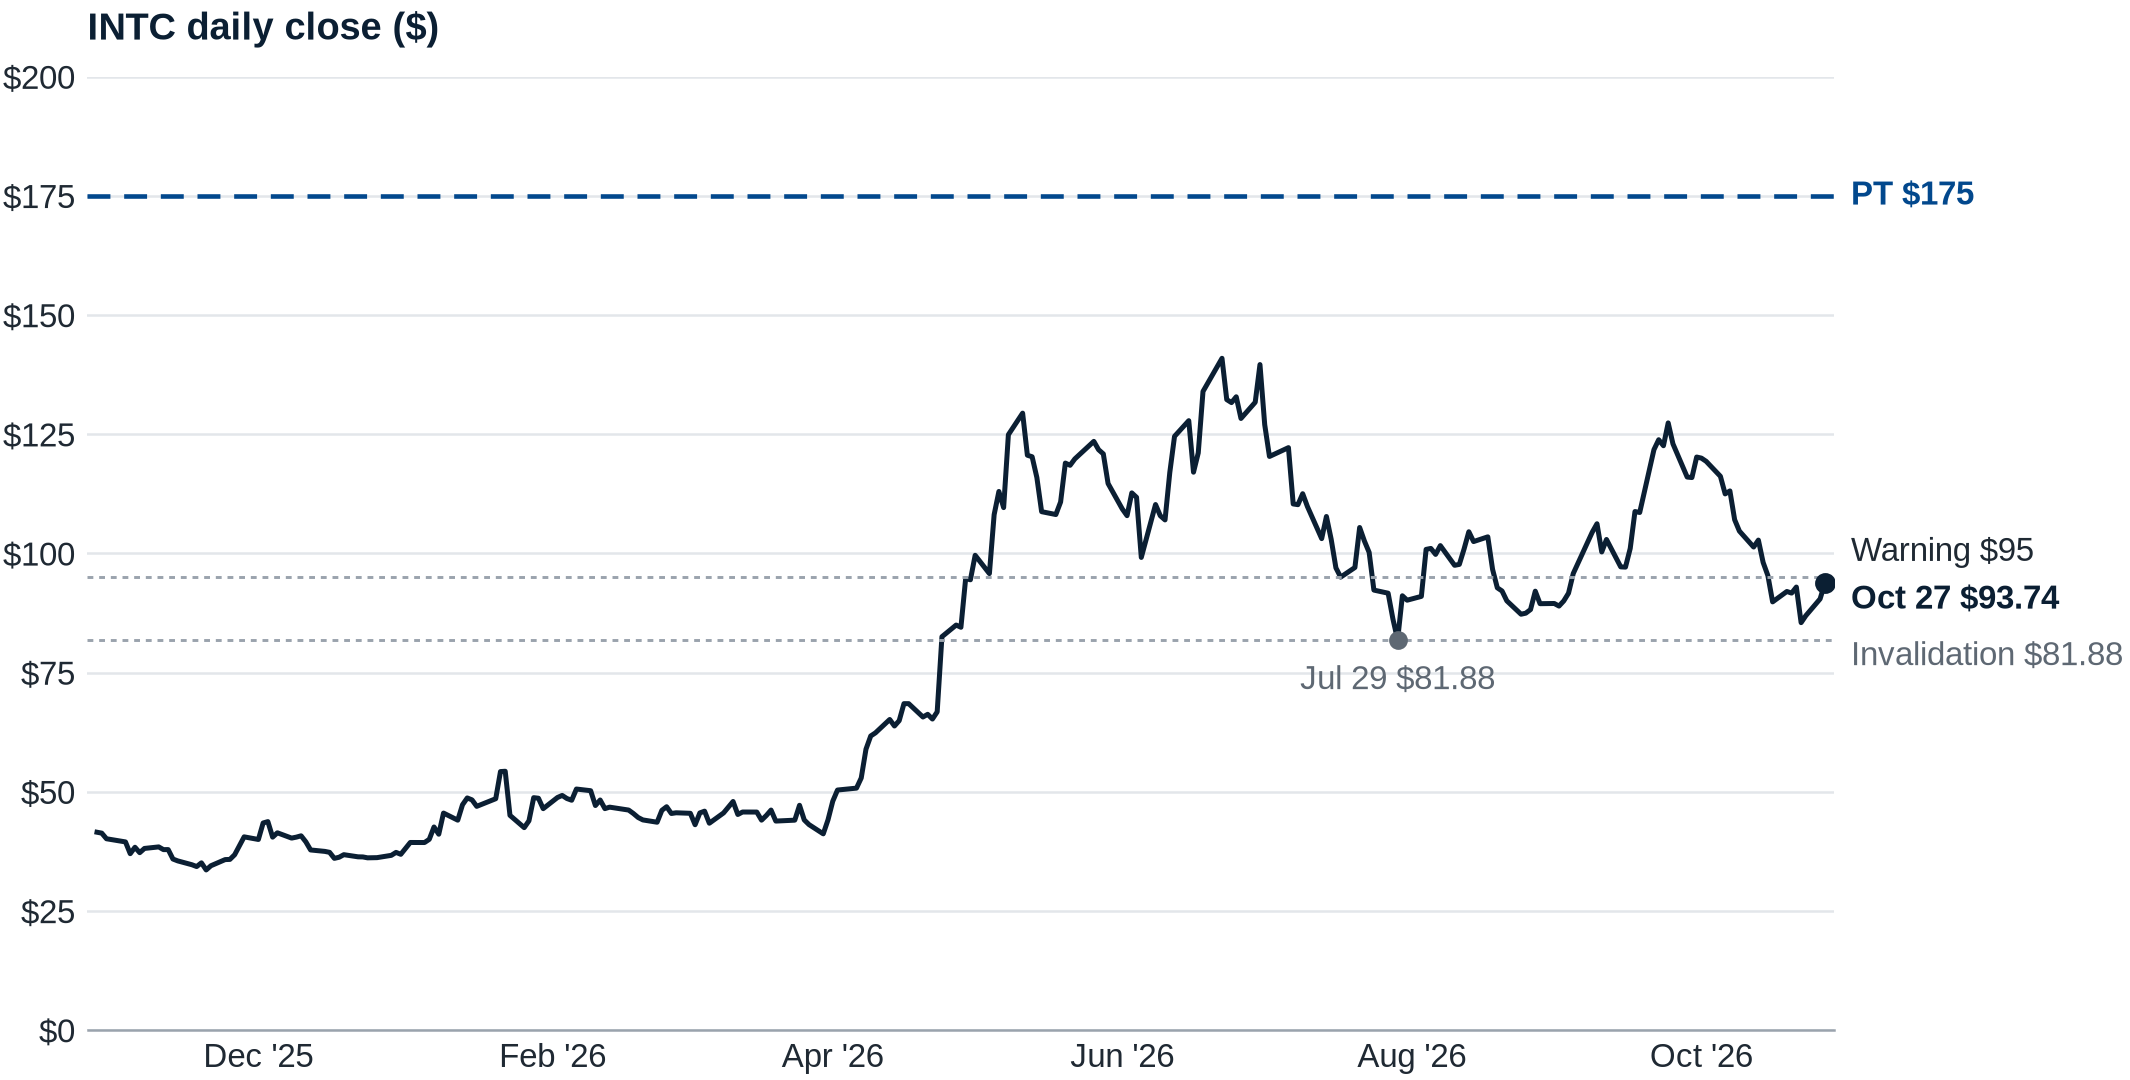
Exhibit 10: INTC share price, last 12 months, with our $175 price target
Daily close, $ per share, Oct 28, 2025 to Oct 27, 2026. The PT implies +86.7% from the Oct 27 close of $93.74.
Source: Nasdaq INTC daily closes (accessed Oct 27, 2026); INH Capital (PT and levels).
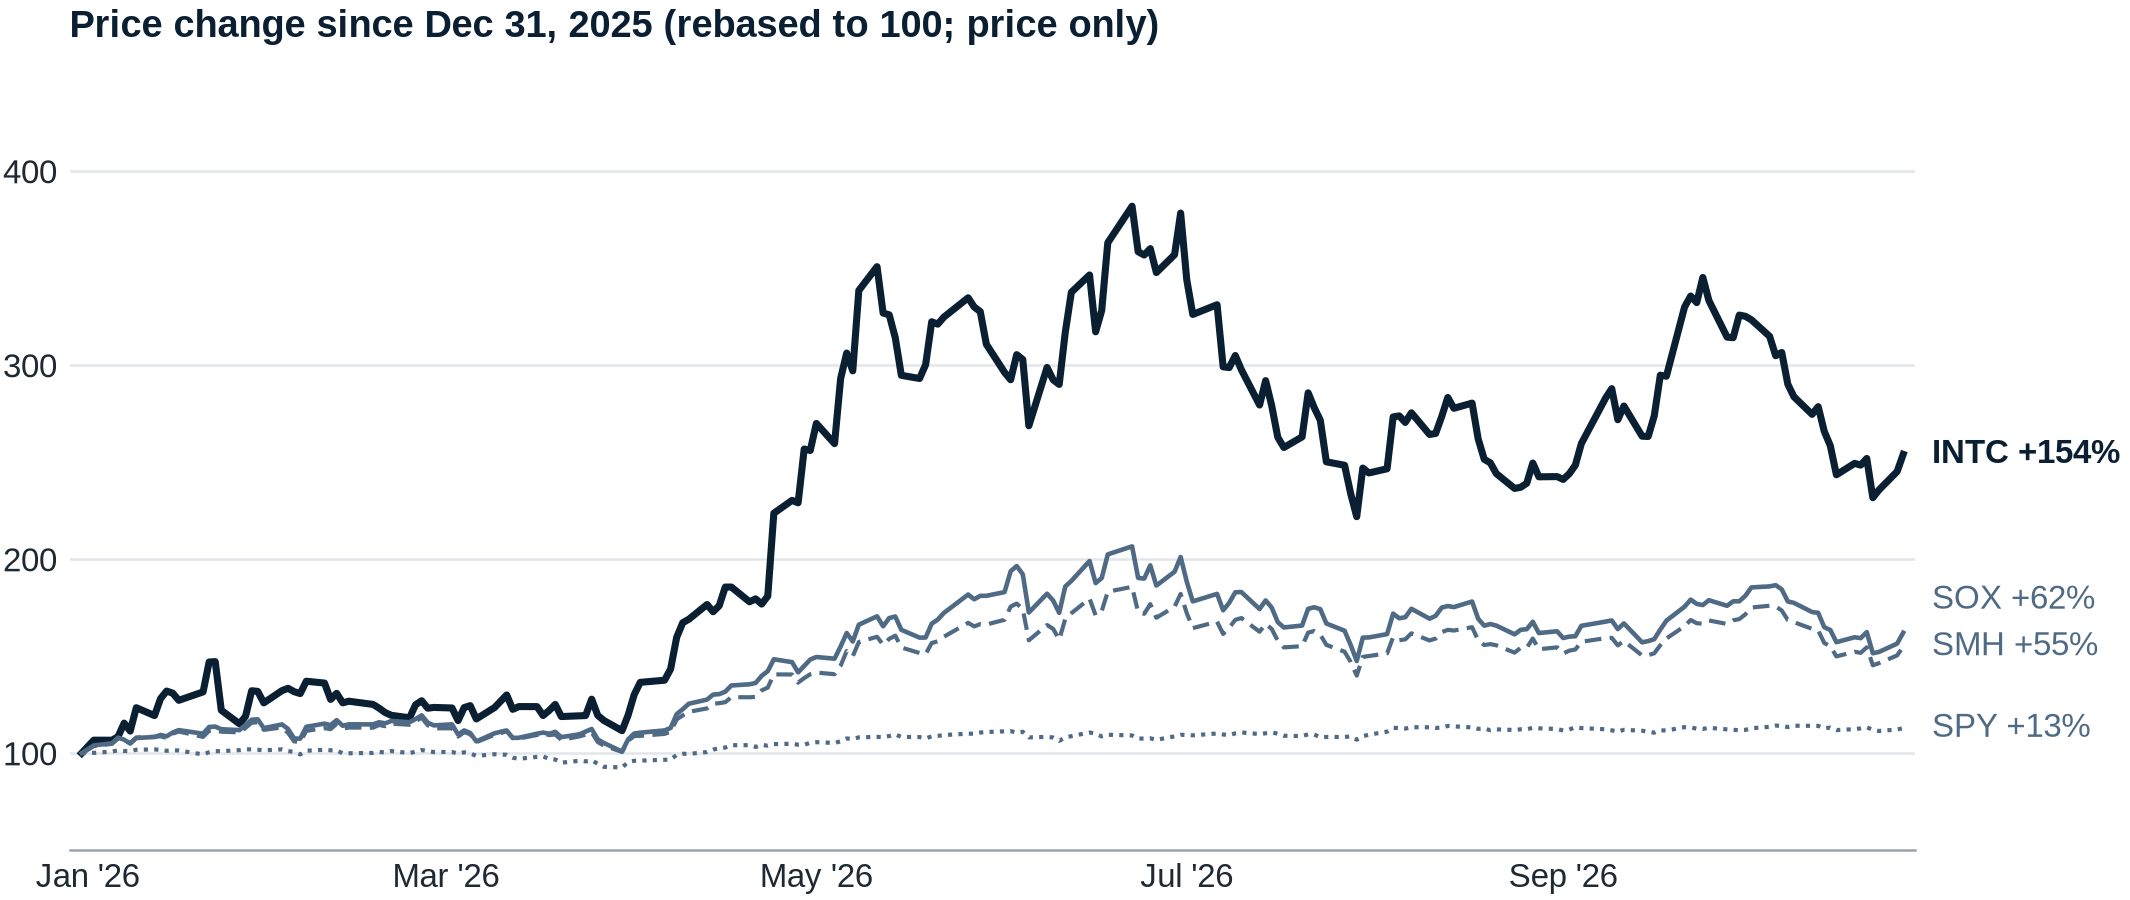
Exhibit 11: INTC vs the SOX semiconductor index, SMH and SPY, year to date
Price change since the Dec 31, 2025 close, rebased to 100, through Oct 27, 2026. Price only; dividends excluded.
Source: Nasdaq daily closes for INTC, SOX (PHLX Semiconductor index), SMH and SPY (accessed Oct 27, 2026); INH Capital calculations.
| Price change to Oct 27, 2026 | INTC | SOX | SMH | SPY |
|---|---|---|---|---|
| Year to date | +154.0% | +62.1% | +54.9% | +12.9% |
| One year | +137.1% | +60.2% | +55.0% | +12.3% |
Source: Nasdaq daily closes (accessed Oct 27, 2026); INH Capital calculations. Price only.
- Levels: our $95 warning level (the August offering price) gave way on Oct 16, and the stock has closed below it on every session since, with a low close of $85.49 on Oct 22. We keep the thesis while the stock holds above $81.88 (the Jul 29 low close); it is 14.5% above that level and 1.3% below $95.
- Tape: $93.74 is below the 20-day ($101.70) and 50-day ($101.67) averages and above the 200-day ($86.30). It is 34.1% below the Jun 30 intraday high of $142.35. Realized volatility (20 days) is ~54%. The stock rose 7.8% in the two sessions to Oct 27.
15. What we are listening for on the call
The question for this print is whether the investment is being made because customers have committed. We are listening for language that moves foundry from engagement to obligation.
| Topic | What would strengthen our view | What would weaken our view |
|---|---|---|
| Signed foundry customers (18A-P, 14A) | A count of committed external customers, or a named or described lead customer (for example, a leading mobile and PC chip designer) | "Engagements remain active" with no change in count or stage |
| Committed volumes and order values | Committed wafer volumes, lifetime contract value or backlog in dollars for foundry and packaging | Pipeline language without dollars or volumes |
| Customer prepayments | Size and number of customer prepayments, where they sit on the balance sheet, and whether more are in negotiation | Prepayments described as one-off or small |
| Capacity reservations | Reserved capacity or take-or-pay terms on 14A, Intel 3 or EMIB-T | Capacity described as available to any customer, with no reservations |
| 2027 capex and Ohio One | 2027 capex framed against signed commitments; any Ohio acceleration tied to a customer or partner | Capex raised without customer backing, or Ohio pacing unchanged |
| 14A PDK 0.9 and 1.0 | Confirmation that PDK 0.9 is with external customers (or a firm date before year end), PDK 1.0 still in early 2027, the number of customers engaged on 0.9, and design or capacity commitments that follow it | 0.9 moved into 2027, or customer counts unchanged since the April call |
| Advanced packaging | EMIB-T backlog quantified; 2027 customer ramps on schedule; substrate supply secured | Ramp timing pushed beyond 2027 or substrate supply cited as a constraint on revenue |
| Apple | Any confirmation of a committed mobile or PC SoC customer on 18A-P or 14A | A denial, or language that the largest prospects are still evaluating |
Source: INH Capital.
Our checklist for the print:
- Q3 non-GAAP gross margin of 43% or more, with pricing named as a driver.
- Q4 guide: revenue midpoint of $18.0B or more; non-GAAP GM of 43% or more.
- DCAI revenue above $7.0B with server units growing.
- Customer prepayment and commitment language, per the table above.
- 14A PDK 0.9 delivered to external customers (guided for October), PDK 1.0 timing and customer count; 18A yields and Panther Lake cost.
- Foundry operating loss below $2.09B; external revenue.
- EMIB-T backlog: "growing," or quantified.
- FY26 free cash flow language, including substrate prepayments.
- Diluted share count after the offering, escrow releases and the stock portion of the Classiq deal.
Appendix
Table A1: Intel guide vs reported, non-GAAP, Q4 2023 to Q2 2026
| Quarter | Revenue guide ($B) | Revenue reported ($B) | GM guide | GM reported | EPS guide | EPS reported |
|---|---|---|---|---|---|---|
| Q4'23 | 14.6-15.6 | 15.41 | 46.5% | 48.8% | $0.44 | $0.54 |
| Q1'24 | 12.2-13.2 | 12.72 | 44.5% | 45.1% | $0.13 | $0.18 |
| Q2'24 | 12.5-13.5 | 12.83 | 43.5% | 38.7% | $0.10 | $0.02 |
| Q3'24 | 12.5-13.5 | 13.28 | 38.0% | 18.0% | -$0.03 | -$0.46 |
| Q4'24 | 13.3-14.3 | 14.26 | 39.5% | 42.1% | $0.12 | $0.13 |
| Q1'25 | 11.7-12.7 | 12.67 | 36.0% | 39.2% | $0.00 | $0.13 |
| Q2'25 | 11.2-12.4 | 12.86 | 36.5% | 29.7% | $0.00 | -$0.10 |
| Q3'25 | 12.6-13.6 | 13.65 | 36.0% | 40.0% | $0.00 | $0.23 |
| Q4'25 | 12.8-13.8 | 13.67 | 36.5% | 37.9% | $0.08 | $0.15 |
| Q1'26 | 11.7-12.7 | 13.58 | 34.5% | 41.0% | $0.00 | $0.29 |
| Q2'26 | 13.8-14.8 | 16.13 | 39.0% | 41.8% | $0.20 | $0.42 |
| Q3'26 | 15.8-16.8 | INH 17.6 | 42.0% | INH 44.9% | $0.38 | INH $0.55 |
Source: Intel 8-K Ex. 99.1 earnings releases, Q3 2023 to Q2 2026, Business Outlook and results tables (SEC EDGAR, accessed Oct 12, 2026). Q4'25 guide excluded Altera after its deconsolidation.
Table A2: Margins, opex, capex and free cash flow (non-GAAP unless noted, $M)
| Quarter | Rev. | Non-GAAP GM | Non-GAAP opex | Non-GAAP op. income | Op. margin | Operating cash flow | Gross capex | Adj. free cash flow |
|---|---|---|---|---|---|---|---|---|
| Q3'24 | 13,284 | 18.0% | 4,762 | -2,369 | -17.8% | n/a | n/a | n/a |
| Q4'24 | 14,260 | 42.1% | 4,633 | 1,368 | 9.6% | 3,165 | 6,271 | -1,503 |
| Q1'25 | 12,667 | 39.2% | 4,271 | 690 | 5.4% | 813 | 6,203 | -3,680 |
| Q2'25 | 12,859 | 29.7% | 4,316 | -503 | -3.9% | 2,050 | 4,492 | -1,050 |
| Q3'25 | 13,653 | 40.0% | 3,932 | 1,524 | 11.2% | 2,546 | 2,956 | 896 |
| Q4'25 | 13,674 | 37.9% | 3,975 | 1,205 | 8.8% | 4,288 | 4,021 | 2,222 |
| Q1'26 | 13,577 | 41.0% | 3,902 | 1,668 | 12.3% | 1,096 | 4,963 | -2,016 |
| Q2'26 | 16,128 | 41.8% | 3,967 | 2,770 | 17.2% | 7,006 | 2,652 | -8,419 |
Source: Intel 8-K Ex. 99.1 earnings releases, non-GAAP and adjusted free cash flow reconciliations, Q3 2024 to Q2 2026 (SEC EDGAR, accessed Oct 12, 2026). Q4'24 cash flow items from the comparative column of the Q4'25 release. Q2'26 adjusted free cash flow includes -$12.2B of net partner contributions. The Q1'26 and Q2'26 gross capex figures in the releases ($7.6B combined) do not tie to the $6.2B year-to-date additions in the Q2 2026 10-Q cash flow statement; we show the release figures.
- Opex has held near $3.9-4.0B for four quarters, so the Q2 jump to a 17.2% operating margin came almost entirely from gross margin and revenue. Free cash flow is still negative in 2026 because of partner flows and back-end prepayments, which keeps FY26 free cash flow language on our watch list.
Table A3: Segment revenue and operating income ($M)
| Quarter | CCG / CCPG revenue | CCG / CCPG op. income | DCAI revenue | DCAI op. income | Foundry revenue | Foundry op. income | All other revenue | All other op. income |
|---|---|---|---|---|---|---|---|---|
| Q1'25 | 7,629 | 2,361 | 4,126 | 575 | 4,667 | -2,320 | 943 | 103 |
| Q2'25 | 7,871 | 2,053 | 3,939 | 633 | 4,417 | -3,168 | 1,053 | 69 |
| Q3'25 | 8,535 | 2,694 | 4,117 | 964 | 4,235 | -2,321 | 993 | 100 |
| Q4'25 | 8,193 | 2,209 | 4,737 | 1,250 | 4,507 | -2,509 | 574 | -8 |
| Q1'26 | 7,727 | 2,516 | 5,052 | 1,542 | 5,421 | -2,437 | 628 | 102 |
| Q2'26 | 8,877 | 2,343 | 6,262 | 2,474 | 5,765 | -2,089 | 701 | 230 |
| Q3'26E | 9,050 | n/a | 7,600 | n/a | n/a | -1,900 | n/a | n/a |
| Q4'26E | n/a | n/a | 8,000 | n/a | n/a | n/a | n/a | n/a |
Source: Intel 8-K Ex. 99.1, Supplemental Operating Segment Results, Q1 2025 to Q2 2026 (SEC EDGAR, accessed Oct 12, 2026); INH Capital estimates. All other includes Mobileye and, before Sep 12, 2025, Altera. Segment revenue includes intersegment sales.
Disclosures
INH Capital invests its own capital. We publish the research behind it. We are not an investment adviser and do not manage client funds. This note is for informational purposes only and is not investment advice or an offer to buy or sell any security. INH Capital and its principal may hold positions in the securities discussed. Figures labeled INH are our own estimates; they are not company guidance or consensus. Statements labeled as INH views or inferences, including our view on Apple, on Ohio One and on the effect of the 14A PDK 0.9, are our opinions and are not confirmed by the companies named. Reported items are attributed to their sources and have not been verified by INH. Opinions are as of the date above and may change.
Sources
Accessed Oct 27, 2026 unless noted.
- Intel Q2 2026 earnings release (8-K Ex. 99.1, Jul 23, 2026): https://www.sec.gov/Archives/edgar/data/50863/000005086326000155/q226earningsrelease.htm
- Intel Form 10-Q, quarter ended Jun 27, 2026: https://www.sec.gov/Archives/edgar/data/50863/000005086326000157/intc-20260627.htm
- Intel Q2 2026 earnings call transcript (Jul 23, 2026; Quartr via stockanalysis): https://stockanalysis.com/stocks/intc/transcripts/653928-q2-2026/
- Deutsche Bank 2026 Technology Conference, CFO David Zinsner (Aug 26, 2026; accessed Oct 1, 2026): https://stockanalysis.com/stocks/intc/transcripts/736613-deutsche-bank-2026-technology-conference/
- 424B5 prospectus supplement (Aug 12, 2026): https://www.sec.gov/Archives/edgar/data/50863/000119312526345221/d98483d424b5.htm ; offering 8-K: https://www.sec.gov/Archives/edgar/data/50863/000119312526346806/d117670d8k.htm
- Intel 2025 Form 10-K (supplier prepayments risk factor).
- Intel IR calendar, Q3 2026 earnings call Oct 29, 2026, 2:00 PM PT: https://www.intc.com/news-events/ir-calendar
- Yahoo Finance, INTC analysis (consensus, EPS trend, revisions and earnings history; 5:50 PM ET): https://finance.yahoo.com/quote/INTC/analysis/
- stockanalysis.com forecast and statistics (S&P Global Market Intelligence): https://stockanalysis.com/stocks/intc/forecast/ ; https://stockanalysis.com/stocks/intc/statistics/
- Nasdaq historical prices, quote and option chain (Oct 30 and Nov 6, 2026 expiries; Oct 27 closing quotes): https://www.nasdaq.com/market-activity/stocks/intc/option-chain
- Nasdaq INTC short interest and analyst research: https://www.nasdaq.com/market-activity/stocks/intc/short-interest ; https://www.nasdaq.com/market-activity/stocks/intc/analyst-research
- Intel press release, "Intel to Acquire Classiq to Create a Full-stack Quantum Computing Platform" (Oct 26, 2026, 4:30 PM EDT): https://www.intc.com/news-events/press-releases/detail/1784/intel-to-acquire-classiq-to-create-a-full-stack-quantum
- Calcalist (Ctech), Classiq price and consideration (Oct 2026): https://www.calcalistech.com/ctechnews/article/rygzvmpngg ; Bloomberg (Oct 27, 2026): https://news.bloomberglaw.com/mergers-and-acquisitions/intel-to-acquire-startup-classiq-in-quantum-computing-push-1
- Tom's Hardware, Intel confirms price hikes on select consumer and server CPUs (Jul 3, 2026): https://www.tomshardware.com/pc-components/cpus/intel-confirms-price-hikes-on-select-consumer-and-server-cpus-citing-supply-costs-and-demand-select-xeon-processors-now-over-usd1-000-more-expensive
- Yicai, Intel CPU price increases (Jul 6, 2026): https://www.yicaiglobal.com/news/intel-hikes-cpu-prices-adding-to-pc-industrys-cost-pressures
- TrendForce citing Commercial Times, server CPU prices (Apr 22, 2026): https://www.trendforce.com/news/2026/04/22/news-server-cpu-prices-up-as-much-as-20-since-march-intel-may-raise-prices-another-8-10-in-2h26/
- CRN, Intel executive confirms CPU price increases for OEMs (2026): https://www.crn.com/news/components-peripherals/2026/intel-exec-confirms-cpu-price-increases-for-oems-amid-supply-crunch
- Wall Street Journal, Apple and Intel preliminary chip-making agreement (May 8, 2026): https://www.wsj.com/tech/apple-intel-have-reached-preliminary-chip-making-agreement-69eb9370 ; Reuters via Investing.com: https://www.investing.com/news/stock-market-news/apple-intel-have-reached-preliminary-chipmaking-deal-wsj-reports-4673596 ; Bloomberg (May 5, 2026): https://www.bloomberg.com/news/articles/2026-05-05/apple-explores-using-intel-and-samsung-to-build-main-device-chips-in-the-us
- Intel newsroom, Ohio One construction timeline update (Feb 28, 2025): https://www.intel.com/content/www/us/en/newsroom/news/corporate/ohio-one-construction-timeline-update.html ; CNBC (Oct 21, 2026): https://www.cnbc.com/2026/10/21/intel-hits-construction-milestone-at-delayed-ohio-chip-fab-.html ; Axios Columbus (Oct 22, 2026): https://www.axios.com/local/columbus/2026/10/22/intel-ohio-one-construction-milestone-2026 ; Ohio News (Husted): https://www.ohio.news/stories/potential-intel-partnership-could-speed-construction-at-delayed-ohio-semiconductor-project/
- Economic Daily News via GMT Eight, substrate prepayments (Oct 24, 2026): https://gmteight.com/content/detail/444103
- Reuters via The Economic Times, Intel and 3DGS Odisha substrate plant (May 29, 2026): https://economictimes.indiatimes.com/tech/technology/intel-3dgs-to-set-up-3-3-billion-substrate-plant-in-odisha/articleshow/131402771.cms
- TrendForce, Google HumuFish and EMIB-T substrate yields (Oct 22, 2026): https://www.trendforce.com/news/2026/10/22/breaking-google-reportedly-sticks-with-intel-emib-t-despite-35-substrate-yields-as-humufish-schedule-tightens/ ; TrendForce, EMIB substrate yields (Sep 23, 2026): https://www.trendforce.com/news/2026/09/23/breaking-intel-emib-substrate-yields-reportedly-hit-45-suppliers-eye-60-by-1q27/
- Tom's Hardware, Google TPU packaging (Jun 10, 2026): https://www.tomshardware.com/tech-industry/google-reportedly-books-intel-for-more-than-3-million-tpus-in-2028 ; EMIB-T for ninth-generation TPU (Jul 15, 2026): https://www.tomshardware.com/tech-industry/semiconductors/intels-emib-packaging-gains-traction-as-chip-designers-look-to-skirt-tsmcs-cowos-constraints-googles-reported-decision-for-9th-gen-tpus-highlights-intels-attractive-alternative
- CNBC, Intel packaging customers (Apr 30, 2026): https://www.cnbc.com/2026/04/30/intel-has-best-month-ever-after-years-of-losing-to-tsmc-and-nvidia.html ; Apple report (May 8, 2026): https://www.cnbc.com/2026/05/08/intel-stock-apple-chip-deal.html
- Intel quarterly earnings releases, 8-K Ex. 99.1, Q3 2023 to Q1 2026 (SEC EDGAR), as listed in our Oct 12, 2026 note.
- Nasdaq historical prices API, daily closes for INTC, AMD, NVDA, TSM, QCOM, AVGO, SMH, SPY and SOX: https://api.nasdaq.com/api/quote/INTC/historical?assetclass=stocks
- SEC EDGAR XBRL company facts, Intel: https://data.sec.gov/api/xbrl/companyfacts/CIK0000050863.json
- Fool.com and Yahoo Finance, Oct 22, 2026 sector selloff: https://www.fool.com/investing/2026/10/22/why-intel-stock-fell-today/
- Intel Q1 2026 earnings call transcript (Apr 23, 2026; Motley Fool): https://www.fool.com/earnings/call-transcripts/2026/04/23/intel-intc-q1-2026-earnings-transcript/
- Tom's Hardware, 14A PDK 0.9 due in October; CEO remarks at an investor conference on May 19, 2026 (May 20, 2026): https://www.tomshardware.com/tech-industry/semiconductors/intel-kicks-off-development-on-next-decade-10a-and-7a-process-technologies-14a-node-remains-on-track-for-critical-october-pdk-release
- TrendForce, 14A high-volume production pulled forward to 2028 (Jul 24, 2026): https://www.trendforce.com/news/2026/07/24/news-intel-pulls-forward-14a-timeline-by-one-year-targeting-2028-mass-production-near-tsmcs-roadmap/
- Wccftech, CEO remarks at the CASPA fireside chat on Oct 24, 2026, including 14A PDK 0.9 and 1.0 timing (Oct 26, 2026): https://wccftech.com/intels-ceo-reportedly-had-a-conversation-with-amds-lisa-su-on-potential-areas-of-collaboration-says-0-9-pdk-on-the-14a-process-coming-soon/
- Intel Foundry Direct Connect press release, early 14A PDK to lead customers (Apr 29, 2025): https://www.intc.com/news-events/press-releases/detail/1739/intel-foundry-gathers-customers-and-partners-outlines
Rating and price target history
| Date | Version | Rating | Price target | Note |
|---|---|---|---|---|
| Oct 27, 2026 | v1.0 | Not rated | $175 | Intel (INTC): Finding Foundry (Q3 FY26 preview) |
| Oct 28, 2026 | v1.1 | Not rated | $175 | Intel (INTC): Finding Foundry (preview update) |
| Oct 30, 2026 | v2.0 | Hold | $80 | Intel (INTC): Downgrade to Hold, PT $80 (Q3 FY26 results, rating change) |
Source: INH Capital. The preview carried a price target and a Top Buy conviction listing but no formal published rating; the Oct 30 note is our first formal rating on Intel.
Version history
Versioning: a major version (v1.0, v2.0) is a new note or a rating or price target change; a minor version (v1.1) is an update to an existing note that keeps the rating and price target. Earlier versions are never overwritten; they stay online with a pointer to the latest version.
| Version | Date | Note | Changes |
|---|---|---|---|
| v1.0 | Oct 27, 2026 | Q3 FY26 earnings preview | Preview published; PT $175; Q3 non-GAAP EPS estimate $0.55 |
| v1.1 | Oct 28, 2026 | Q3 FY26 earnings preview | Headline renamed to "Intel (INTC): Finding Foundry"; year-end label removed from the price target (now "PT $175"); estimates updated (Q3 EPS $0.55, Q3 gross margin 44.9%; prices and consensus as of the Oct 27 close) |
| v2.0 | Oct 30, 2026 | Q3 FY26 results: downgrade | Rating set to Hold; PT cut from $175 to $80; preview marked as superseded, with its content left unchanged |
Source: INH Capital.
INH Capital invests its own capital. We publish the research behind it. We are not an investment adviser and do not manage client funds.
For informational purposes only. Research, ratings, signals (including Strong Buy / Buy / Hold / Sell), price targets, technical analysis, sentiment, and flow data are opinions of INH Capital, not recommendations to buy, sell, or hold any security. They do not mean you should take any trade. Every reader must do their own due diligence and form an independent decision. Not investment advice. Not a solicitation or offer to buy or sell securities. INH Capital is not a registered investment adviser. Past performance is not indicative of future results.